Save to My DOJO

Table of contents
The Universal Dashboard PowerShell module gives VMware Administrators, that know PowerShell, the versatility to create amazing charts and reports with minimal programming knowledge. In the last year, one of the new features implemented was Nivo charts. These are beautiful looking charts that are built on React. React is a javascript library built by Facebook and it runs smooth as butter! I’m going to provide an example of a TreeMap and Calendar chart that I made for ESXi. They provide useful information that lets you easily see VCenter information in a graphical format, like a charted view of VM sizes and more!
Again, in this post, we’re going to look at how you can use this free script as well as the PowerShell Universal dashboard to get a graphical representation of your VMs in a given datastore. Additionally, we’ll also show you how you can use the same strategy to get a graphical heatmap of event logs! Let’s take a look!
Prerequisites
The PowerShell Universal Dashboard is built on .NET Core, so it can literally run anywhere. I’m going to show how to run the dashboard right from a PowerShell console, which is the quickest way to get started using your Dashboard. Beforehand, we will need to install the required PowerShell Modules. First, we will need to install PowerCLI (Linux howto here) since our dashboard is based on data from a VMware environment. To install PowerCLI, we easily just run the following command in an administrative PowerShell console:
Install-Module VMware.PowerCLI -Force
![]()
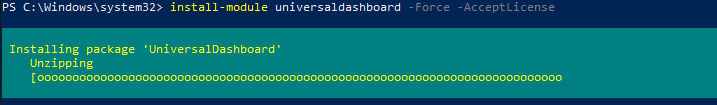
Lastly, we need to install the Universal Dashboard module:
Install-Module UniversalDashboard -Force -AcceptLicense
You may run into the issue where the PowerShellGetFormatVersion ‘2.0’ is not supported by the current version of PowerShellGet message is displayed:
![]()
We will need to install the latest version of PowerShellGet, this task can be pretty tricky and there has been a lot of people that have run into this online. First, we need to install the latest version of PowerShellGet:
Install-Module PowerShellGet -Force
![]()
You can try running:
Uninstall-Module PowershellGet -RequiredVersion 1.0.0.1 -force
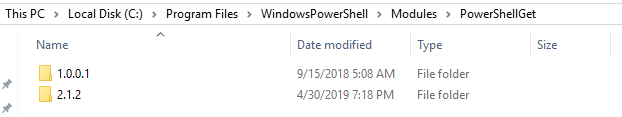
However, sometimes I’ve had bad luck with it and have to just delete the version of PowerShellGet from the modules folder under “Program Files”:
The Source Code
Now that we have the prerequisites installed, we can create the script and run it. Save the code below to a .ps1 file:
#Authentication
$FormLogin = New-UDAuthenticationMethod -Endpoint {
param([PSCredential]$Credentials)
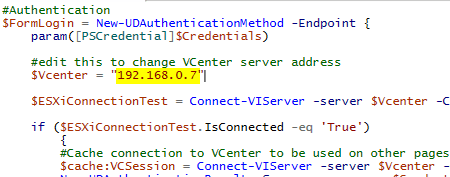
#edit this to change VCenter server address
$Vcenter = "192.168.0.7"
$ESXiConnectionTest = Connect-VIServer -server $Vcenter -Credential $Credentials -NotDefault -Force
if ($ESXiConnectionTest.IsConnected -eq 'True')
{
#Cache connection to VCenter to be used on other pages
$cache:VCSession = Connect-VIServer -server $Vcenter -Credential $Credentials -NotDefault -Force
New-UDAuthenticationResult -Success -username $Credentials.UserName
}
New-UDAuthenticationResult -ErrorMessage "Your Credentials were not able to authenticate with $VCenter."
}
#Login Page
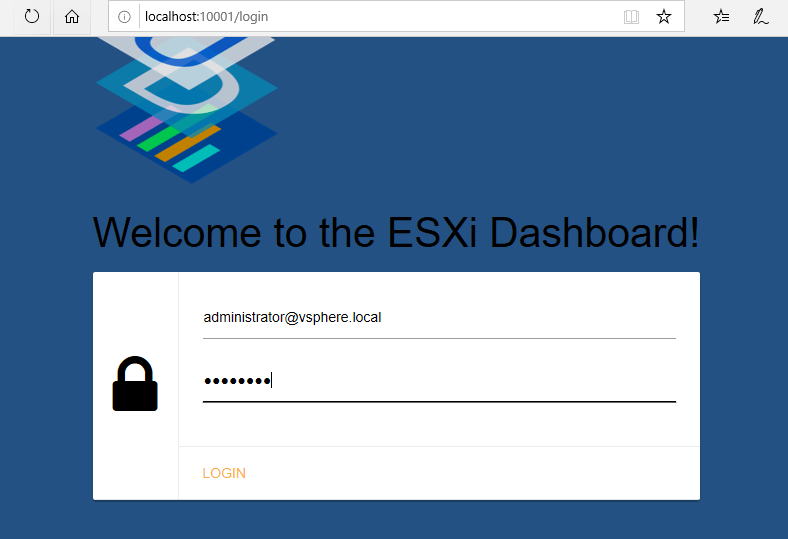
$LoginPage = New-UDLoginPage -AuthenticationMethod $FormLogin -WelcomeText "Welcome to the ESXi Dashboard!"
#home
$homepage = New-UDPage -Name "Home" -icon home -content {
New-UDParagraph -Text "Welcome to the ESXi Dashboard, try out the Treemap and Calendar Charts"
}
$Calpage = New-UDPage -Name "Event-Calendar" -content {
#Get list of hosts for dropdown
if($cache:VCSession.IsConnected -eq "true"){$hosts = (Get-vmhost * -server $cache:VCSession)}
[array]$hostnames = $hosts.name
[array]$hostnames += "All"
New-UDCard -Title 'Event Calendar Chart' -Content {
New-UDInput -submittext "Run" -content {
New-UDInputField -Type select -Name hosts -Values @($hostnames) -DefaultValue ""
} -Endpoint {
Param($Hosts)
#Get Date variable
$date = (Get-date).AddDays(-365)
#Empty array for displaying Charts
$display = @()
#If ALL was selected in the drop down
if($hosts-eq "all") {$hosts = "*"}
$vmhosts = Get-vmhost -name $hosts -server $cache:VCSession
#Get all events that are warnings or errors on each host
Foreach($h in $vmhosts){
#empty array for all events
$allevents = @()
$events = Get-vievent -Entity $h -server $cache:VCSession -Start $date -Types error,Warning
#Create object of day that events occured and how many times a day
Foreach($e in $events){
$obj = New-Object System.Object
$obj| Add-Member -type NoteProperty -name Date -value ("{0:yyyy-MM-dd}" -f ($e.createdtime))
$obj| Add-Member -type NoteProperty -name ErrorCount -value (($events | Where {$_.Createdtime.dayofyear -eq $e.createdtime.DayOfYear}).count)
$allevents += $obj
}
#create chart from object
$display += New-UDCard -Title ($h.name) -content {
New-UDNivoChart -Calendar -Id 'calendarChart' -Data @(
($allevents | Sort-Object date -Unique) | % {
@{
day = ($_.date)
value = ($_.errorcount)
}
}
) -From (Get-Date).AddDays(-90) -To (Get-Date) -Width 600 -Height 400 -MarginTop 50 -MarginRight 10 -MarginLeft 50 -MarginBottom 10 -OnClick {
Show-UDToast -Message $EventData -Duration 3000
}
}
}
#displays the charts when button is pushed
New-UDInputAction -Content $display
}
}
}
$Treepage = New-UDPage -Name "Datastore-Treemap" -content {
#Get list of datastores for dropdown
if($cache:VCSession.IsConnected -eq "true"){$datastores = (Get-Datastore * -server $cache:VCSession)}
[array]$hostnames = $hosts.name
[array]$dsnames = $datastores.name
[array]$dsnames += "All"
New-UDCard -Title 'Datastore Treemap - Size in GB' -Content {
New-UDInput -submittext "Run" -content {
New-UDInputField -Type select -Name datastore -Values @($dsnames) -DefaultValue ""
} -Endpoint {
Param($datastore)
#Empty arrays for displaying Charts
$VMreport=@()
$alldata=@()
$display= @()
#If ALL was selected in the drop down
if($datastore -eq "all") {$datastore = "*"}
$datastores = Get-Datastore $datastore -server $cache:VCSession
#Get VM size on each Datastore
Foreach ($ds in $datastores){
$vms = get-vm -name * -server $cache:VCSession -Datastore $ds
#create object for reporting
ForEach ($vm in $vms)
{
$VMstats = New-Object System.Object
$VMstats | Add-Member -type NoteProperty -name VMName -value $vm.name
$VMstats | Add-Member -type NoteProperty -name VMSize -value ([math]::Round($vm.UsedSpaceGB,2))
$VMstats | Add-Member -type NoteProperty -name DSName -value (Get-Datastore -Id $vm.DatastoreIdList -server $cache:VCSession | Select -ExpandProperty Name)
$VMstats | Add-Member -type NoteProperty -name DSSize -value (Get-Datastore -Id $vm.datastoreidlist -server $cache:VCSession | Select -ExpandProperty FreeSpaceGB)
[array]$VMreport += $VMstats
}
}
#Build chart from hash tables
foreach($ds in ($VMreport.dsname | Sort-Object -Unique)){
$VMchart = $VMreport | Where-Object {$_.dsname -eq "$ds"}
$DatastoreData = @{
name = ($vmchart.dsname | Sort-Object -Unique)
cost = ($vmchart.dssize | Sort-Object -Unique)
children = @()
}
Foreach($vm in $vmchart){
$datastoreData.children += @{
name = $vm.VMname
cost = $vm.VMSize
}
}
$display += New-UDCard -Title ($DatastoreData['name']) -content {
New-UDNivoChart -Id 'treemapChart' -Treemap -Data $DatastoreData -Identity 'name' -Value 'cost' -InnerPadding 3 -OuterPadding 3 -Height 300 -Width 400 -Colors @("#CCCCCC","#1F78B4","#38bcb2") -OnClick {
Show-UDToast -Message $eventdata -Duration 3000
}
}
}
#Create page with all the charts with 2 columns
$Newpage = New-UDRow {
New-UDColumn -SmallSize 6 -MediumSize 8 -LargeSize 12 -Endpoint {
New-UDLayout -Columns 2 -Content {
$display
}
}
}
#Displays the page once the button is pushed
New-UDInputAction -Content $Newpage
}
}
}
#Starting the Dashboard
Get-UDDashboard | Stop-UDDashboard
Start-UDDashboard -Content {
New-UDDashboard -Title "ESXi Dashboard: Charts" -LoginPage $LoginPage -Pages @(
$HomePage,
$Calpage,
$Treepage
)
} -Port 10001 -AllowHttpForLogin -AutoReload
Now we’ll edit the .ps1 and change the VCenter server address to match your environment:
Save the .Ps1 and we are ready to run the dashboard.
Running the Dashboard
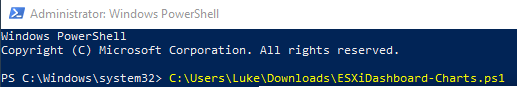
Open up an administrative PowerShell console and paste in the path to the .ps1:
Now open up a browser and navigate to http://localhost:10001. We now get the login screen. Login with whatever admin credentials are used to authenticate with VCenter. The dashboard will take the entered credentials and test authenticating them with VCenter and decide if you are allowed to access the page:
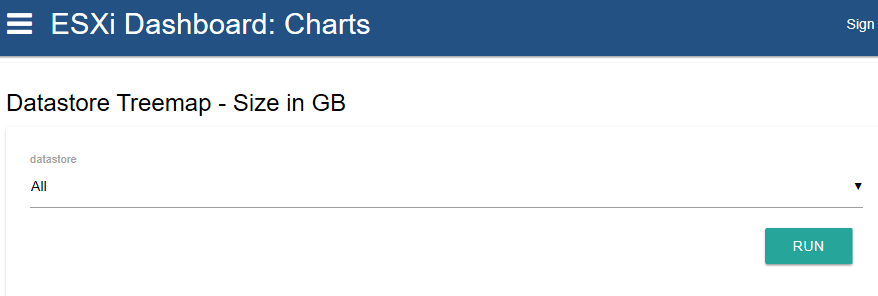
If we look at the TreeMap page we get a drop-down:
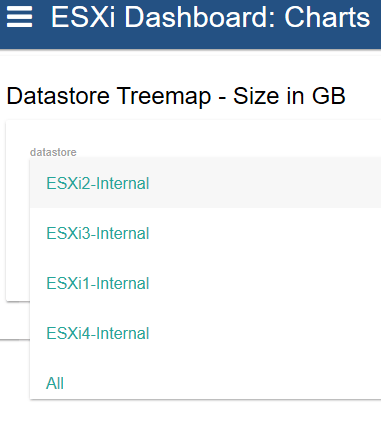
The drop down is an auto-populated list of all Datastores in VCenter and we can select one or ALL to generate a chart for:
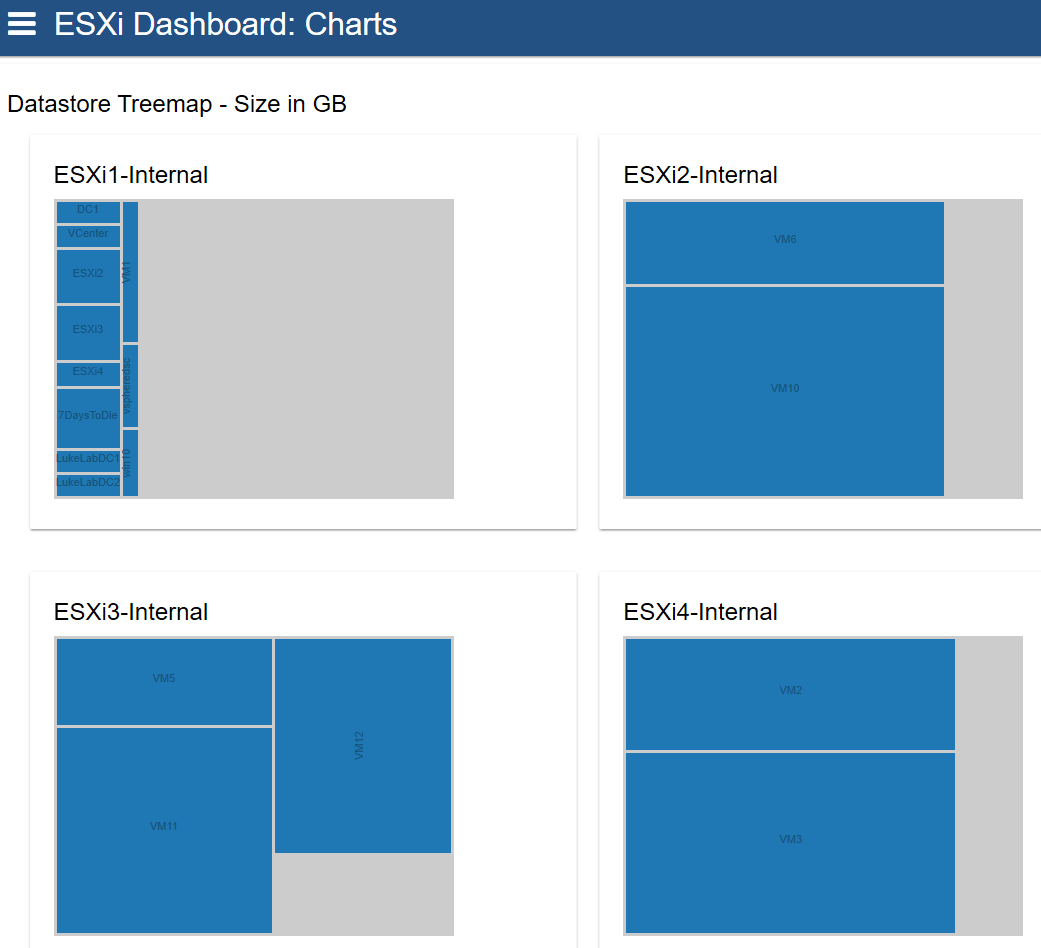
The treemap chart is like WinDirStat, it’s extremely useful for graphically displaying data sizes and I’ve used it to display the VM size of each VM on each datastore. You can quickly tell which ESXi host is running my nested VMware lab:
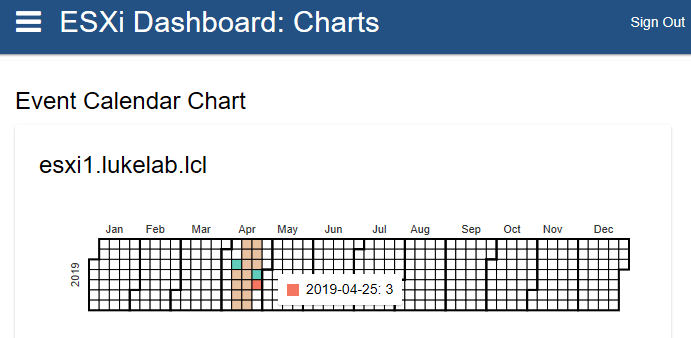
The next chart is a calendar chart. It allows you to present a calendar and mark the calendar with specific values. I’ve used it to plot out the number of times a Warning or Error event has occurred for each ESXi host. The chart basically uses Get-VIEvent to parse through the events log and generates the chart from it:
Wrap-Up
As you can see, you can create some useful and great looking charts for VMware environments. Note that this dashboard is running on HTTP, if you were to implement this in production you would want to follow these steps to implement https with a certificate. Also, note that using the Nivo charts and Login page require a purchased license, but the cost is extremely minimal ($50 -$100) for what you get with the Universal Dashboard. The PowerShell Universal Dashboard is a huge contribution to the PowerShell community and, with a little PowerShell-know-how, can fill in the holes in a VMware administrator’s tool belt.
What about you? Are these two pieces of information you could see yourself using on your own dashboard? Are there other items you’d like to see? Let us know in the comments section below!
Thanks for reading!


Not a DOJO Member yet?
Join thousands of other IT pros and receive a weekly roundup email with the latest content & updates!
More in this category


About the Author

Luke Orellana

