Save to My DOJO
Table of contents
In this post, I’ll provide examples on how to install and configure the vRealize Log Insight agent on both Windows and Linux. The agent captures a multitude of events occurring on both types of operating systems in addition to the information gathered from a vSphere environment. Events are captured from a variety of log files including encrypted folders, provided that the agent is running in the correct user context. The agent is also able to parse raw log files such that structured data is sent to the Log Insight server.
In short, a vRealize Log Insight agent is installed on Windows and Linux machines where it is configured to extract event data from quite a number of log file types. The collected data is periodically forwarded to a vRealize Log Insight server which is then processed and presented in the form of alerts, diagnostic and analytical information.
If you want to learn more about the vRealize Log Insight server, feel free to refer to the vRealize Log Insight: A first look and how to deploy it post.
Agent details
The Linux agent is available in RPM, DEB and BIN formats and is supported on the following 32/64-bit distros:
- Red Hat Enterprise Linux 5, 6, and 7
- SUSE Linux Enterprise Server 11 SP3 and 12 SP1
- Ubuntu 12.04 LTS, 14.04 LTS, and 16.04
The Windows agent is distributed as an MSI installer for the following 32/64-bit Windows operating systems:
- Microsoft Windows Vista or later
- Microsoft Windows Server 2008 or later
Downloading the agent
From the vRealize Log Insight Web interface, select the Administration page from the menu (top right-hand corner). Under the Management section, select Agents and scroll down to the bottom. In my case, the download link was hidden from view. Alternatively, if you have a customer account, you can download the same from my.vmware.com.
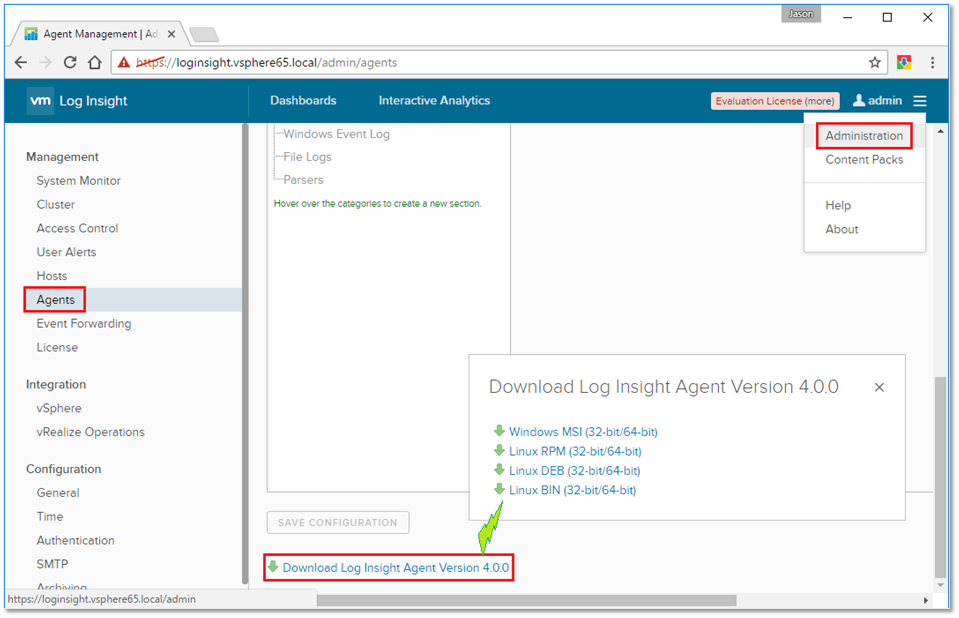
Figure 1 – Downloading agents from the vRealize Log Insight server
The Linux agent
As as example, I’ll be installing the Linux agent on a VM running SUSE Linux Enterprise 11 via the RPM package. The most up to date package at the time of writing (Jan. 2017) is VMware-Log-Insight-Agent-4.0.0-4549831.noarch_192.168.16.51.rpm.
Installing the agent
The basic installation steps are the following:
- Download the RPM package and copy it over to the Linux machine. Use something like WinSCP to copy the RPM package over to the VM.
- Log in as root. Alternatively, you can log in as a lower privileged user and use sudo instead.
- Change over to the folder holding the RPM package – ex. cd /tmp – and run the following command.
rpm -i VMware-Log-Insight-Agent-4.0.0-4549831.noarch_192.168.16.51.rpm
- Verify that the agent installed correctly by running this command:
rpm -qa | grep Log-Insight-Agent
- To verify that the agent is running, run the following command
service liagentd status
Note: The above commands may vary according to the Linux distribution the agent is being installed on.
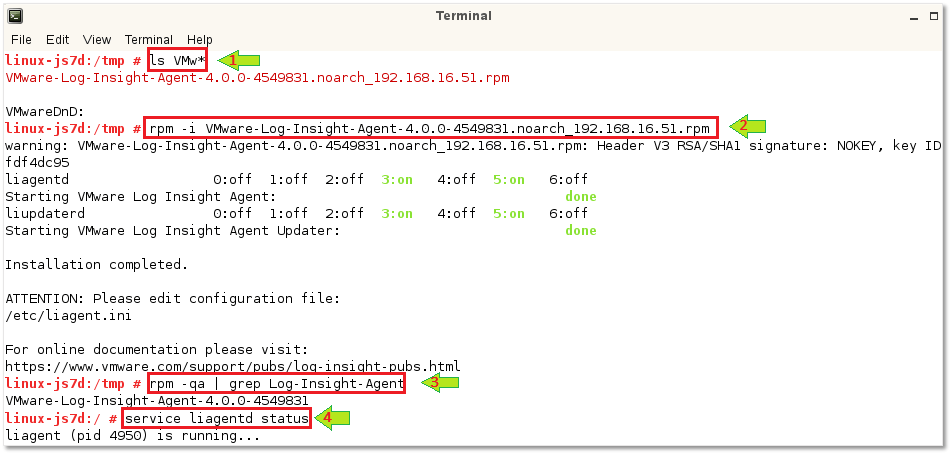
Figure 2 – Installing the Linux agent on SUSE
Configuring the agent
Once the agent is installed, you’ll need to edit a configuration file to have the agent report back to the vRealize Log Insight server. The configuration file is called liagent.ini and is located under /var/lib/loginsight-agent/.
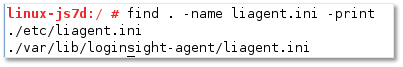
Figure 3 – Linux agent configuration file path on SUSE
The best way to edit the configuration file is via the default editor. To edit liagent.ini run the following:
vi /var/lib/loginsight-agent/liagent.ini
For a basic configuration, edit the values under the respective section headers as follows. For further details, refer to Figure 4.
[server]
1] hostname: This value should match the FQDN of the vRealize Log Insight server. It is set to the correct value automatically when the agent is downloaded from the Log Insight server, otherwise, just uncomment the line and type in the correct FQDN.
2] proto: By default, the cfapi protocol is used. Uncomment this line and leave the value as is.
3] port: The default port for cfapi is 9000. When SSL is enabled on the Log Insight server, the port is automatically set to 9543, which is what I’ve used.
4] ssl: Set to yes if SSL is enabled on the Log Insight server.
The next bit tells the agent which log files it should pick events from. The default configuration includes the messages and syslog log files, standard log files on most Linux deployments.
[filelog|syslog]
5] Directory refers to the location of the log files which are in turn referenced by include, a semicolon delimited string of log file filenames. Wildcards are also supported.
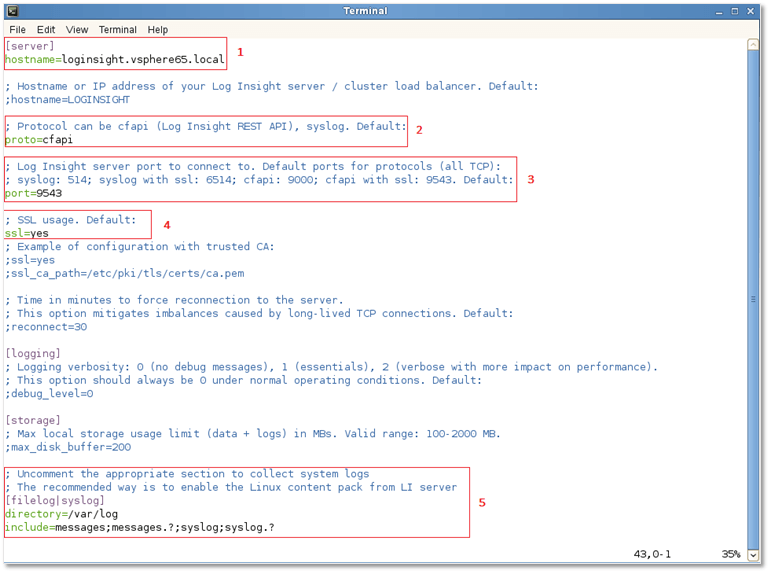
Figure 4 – Editing the configuration file for a Log Insight Linux agent
Once you’re done editing the config file, run service liagentd restart to have the agent pick up the changes.
You can then launch the vRealize Log Insight Server Web interface to verify that the agent is reporting and forwarding events to the server.
Just navigate to Management -> Agents on the Administration page as shown in Figure 4. Under the Agents section, you should see details on the Linux VM where the agent has been installed. Moreover, clicking on the hostname takes you to the Interactive Analytics page from where you can verify whether or not events are being captured.
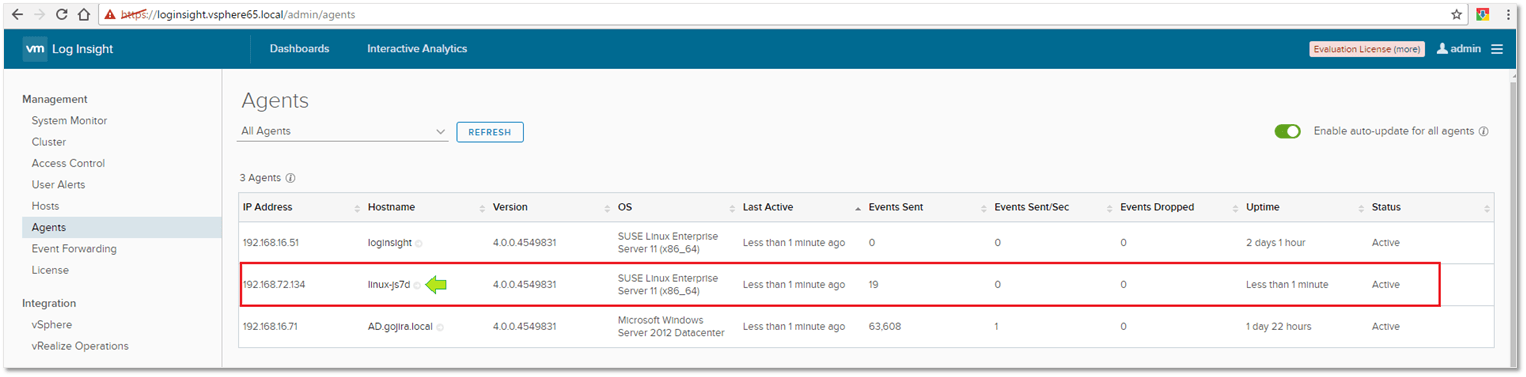
Figure 5 – Verifying agent functionality from the vRealize Log Insight web interface
If no events are displayed or the event graph is blank, you may need to change the collection period as shown in Figure 6.
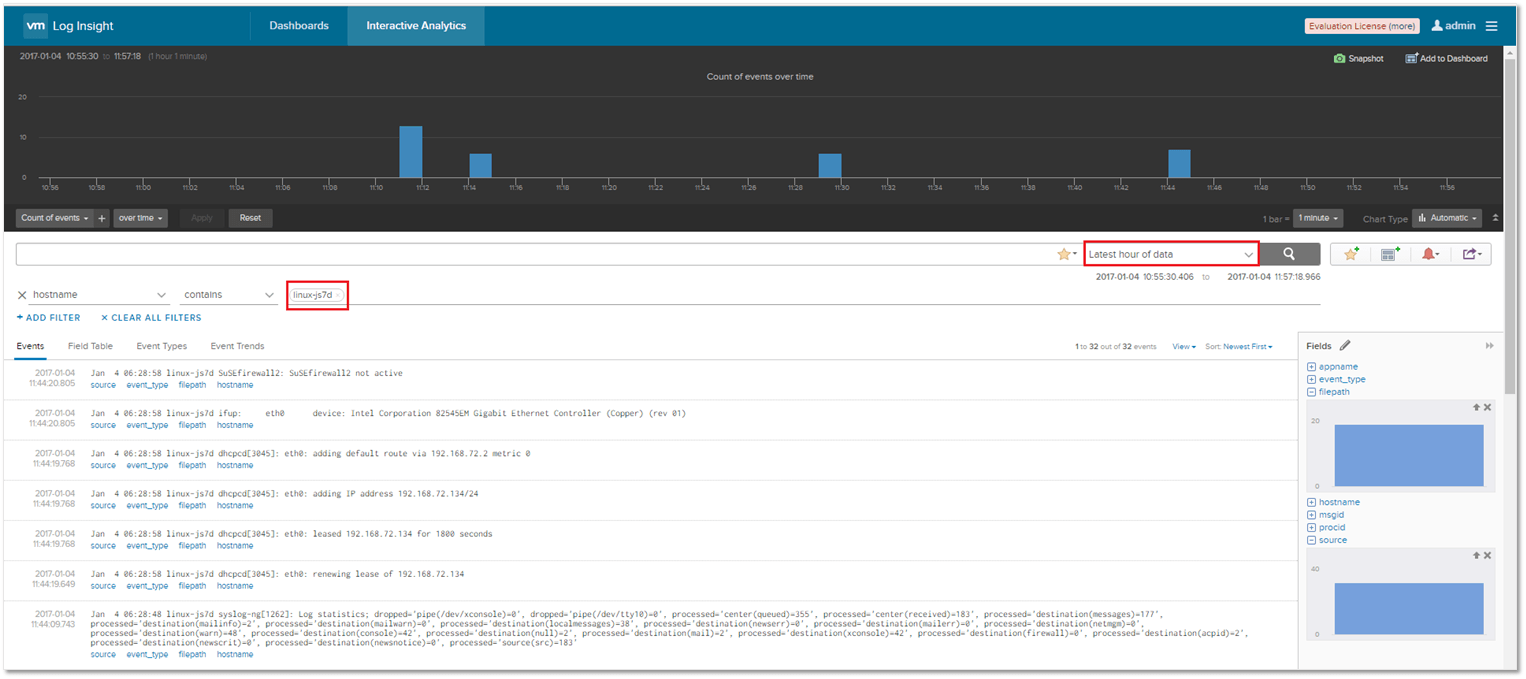
Figure 6 – The Log Insight Interactive Analytics page
In this example, the agent is only capturing events found in the /var/log/messages log file. If I had to tail the log file, the displayed events should tally with those displayed on the Interactive Analytics page albeit in reverse chronological order, which is indeed the case. The difference in time stamp is a result of having a different time zone set on the Linux VM to that set on the Log Insight server.
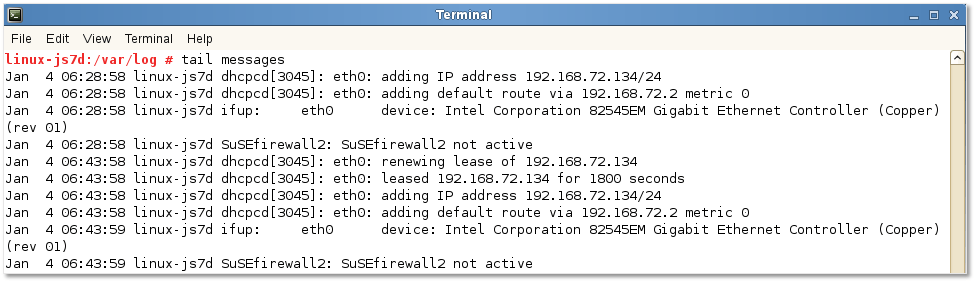
Figure 7 – Tailing the contents of the messages log file for comparison
That’s all there is to monitoring Linux machines via the Log Insight Linux agent. For further details, make sure to visit the Configure the Log Insight Linux Agent page on the VMware website.
The Windows agent
Installing the agent
Installing the agent on Windows is as easy as it gets. For a starter, there’s only one MSI installer to deal with for all the supported 32 and 64-bit Windows flavors. Once installed, the agent runs as a Windows service and is user configured to capture and forward events from event channels such as Security and Application and flat log files such as the ones used by IIS.
To install the agent, double-click the MSI file or right-click on it and select Install from the context menu.
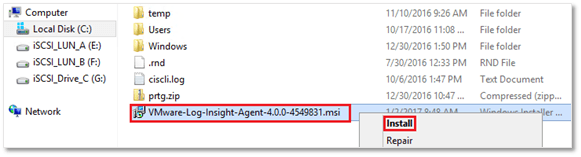
Figure 8 – Installing the Windows Log Insight agent
The installation steps, as per the screens in Fig. 9, are:
1. Accept the license agreement and press Next.
2. Type in the FDQN of the vRealize Log Insight server and press Install.
3. Click on Finish to close the installation wizard.
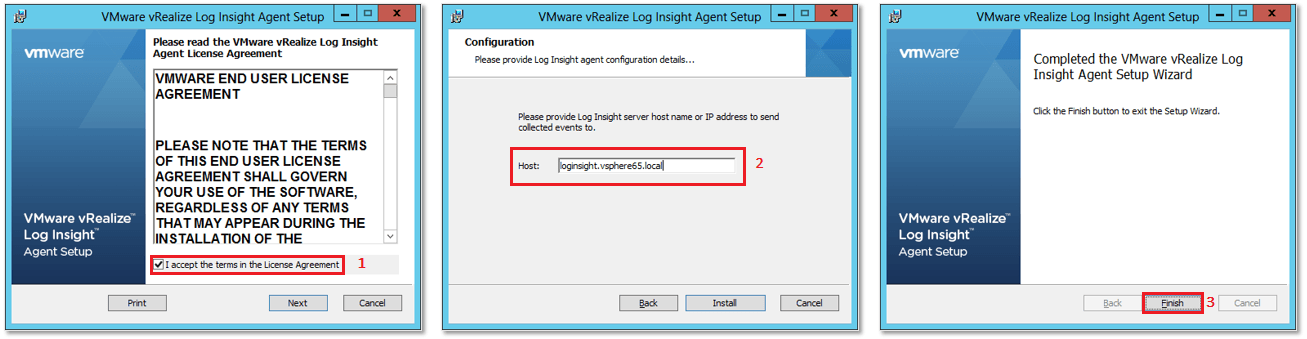
Figure 9 – Running the Windows agent installer
Configuring the agent
The configuration procedure is identical to the one used for the Linux agent. The config file still is liagent.ini, however the correct path is now C:\ProgramData\VMware\Log Insight Agent.
Using Notepad or similar, amend the config file as shown in Figure 10. The settings enabled are the same as those enabled in the Linux agent’s config file save for the section defining the channels and log files to target.
Looking at the section labelled #1 in Fig.10, you’ll notice that the defined channels correspond to the Windows Logs and/or Application and Services Logs exposed in Event Viewer. The default agent configuration includes the Windows’ Application, System and System channels. To enable event forwarding from these channels, just uncomment the relevant lines.
The section labelled #2 is telling the Log Insight agent to collect events from a flat file called DNS.log (include value) found under the C:\DNSLog (directory value). I’ve also set the exclude value to ignore any log files ending in .old, to cater for log rotation. The whole lot is grouped under the section header [filelog|DNS] where the filelog bit indicates a flat log file while the DNS bit is an arbitrary user chosen value.
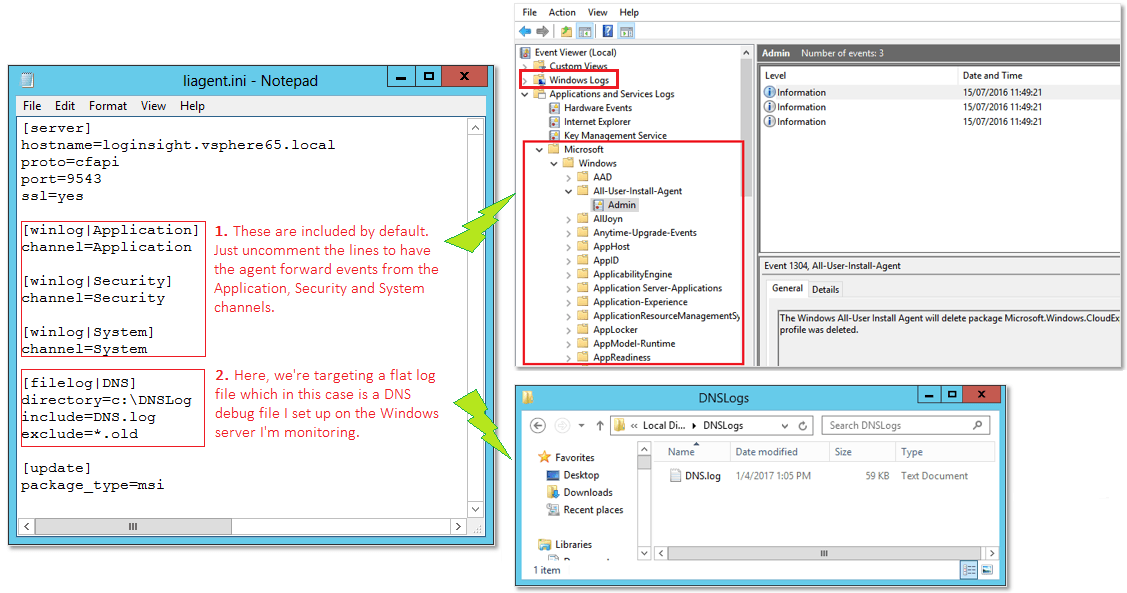
Figure 10 – The Windows agent config file targeting both channels and flat log files
Once again, we use the Log Insight’s web interface to verify that the Windows agent has established a connection and is forwarding events to the Log Insight server.
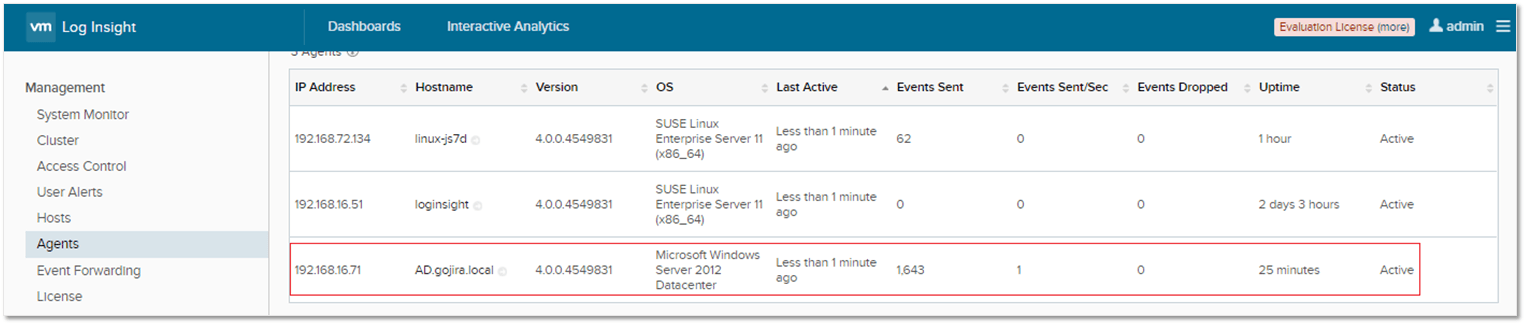
Figure 11 – Windows agent successfully installed and active
On the Interactive Analytics page, I’ve set a filter to display only those events captured from the DNS.log file. The “filepath -> contains -> dnslogs” expression filter restricts the display of events to those captured from the DNS log file. You can add extra filters via the Add Filter component.
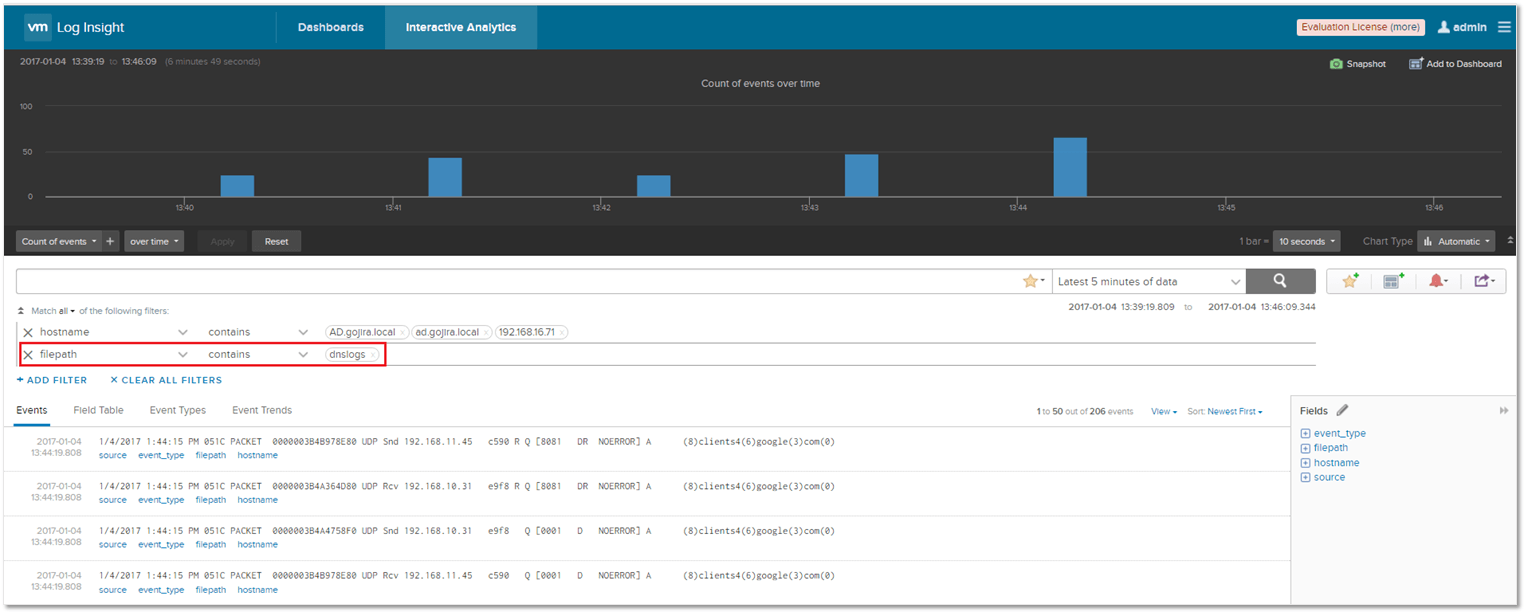
Figure 11 – Using filters to list specific events
Conclusion
As we’ve learned, one can easily monitor and collect events from Windows and Linux machines once the respective Insight agents have been installed and properly configured. Undoubtedly, Log Insight is a great tool as it provides a monitoring and logging solution for all your critical services and more whether they are running on Windows or Linux. At the same time, Log Insight keeps you one step ahead on what’s happening within your vSphere environments.
While hoping you found this post useful, please do keep a tab on this space for more articles on vRealize Log Insight and other VMware topics.
[the_ad id=”4738″][the_ad id=”4796″]


Not a DOJO Member yet?
Join thousands of other IT pros and receive a weekly roundup email with the latest content & updates!
More in this category


About the Author
Jason Fenech

