Save to My DOJO

In Azure, knowing how your VMs, storage accounts, networks, and applications are performing, whether they’re available for your customers to use and if there are anomalies is the job of Azure Log Analytics as part of Azure Monitor. In this article we’ll deep dive into what they offer, how to use it, and what’s new.
You may have heard of OMS, Operations Management Suite, and wondering where it went, or you may be confused as to what the difference between Azure Monitor and Azure Log Analytics is (no thanks to the marketing folks at Microsoft wanting to rename everything regularly). We’ll sort out this confusion with Azure Monitor log analytics.
System Center Operations Manager and Operations Management Suite
If you have a medium to large IT infrastructure on-premises you know that gathering telemetry signals from networking hardware, physical and virtual servers, applications and security tools is vital. Waiting for users to call the helpdesk to let you know that something is wrong doesn’t really work at scale (and doesn’t even work in SMB).
System Center Operations Manager (SCOM) is a popular choice, but it requires a LOT of infrastructures and specialist knowledge to deploy, configure, manage and maintain. It does, however, deliver a lot of value, with Management Packs (MPs) for every Microsoft operating system and application under the sun, as well as for all popular Unix flavors. Each MP comes with monitoring rules and alerts with remediation suggestions so if you’re running SQL Server, there’s an MP, written by the SQL group, with alerts when a particular metric exceeds X value and what the suggested steps are to remediate. There’s also a large third-party ecosystem of MPs so if you have Dell or HP servers for example you can add an MP to SCOM that’ll let you know when a fan in a server is about break because of changes in its spin rate. There’s a guide for migrating from SCOM to Monitor but be aware that the capabilities and focus are somewhat different between the two.
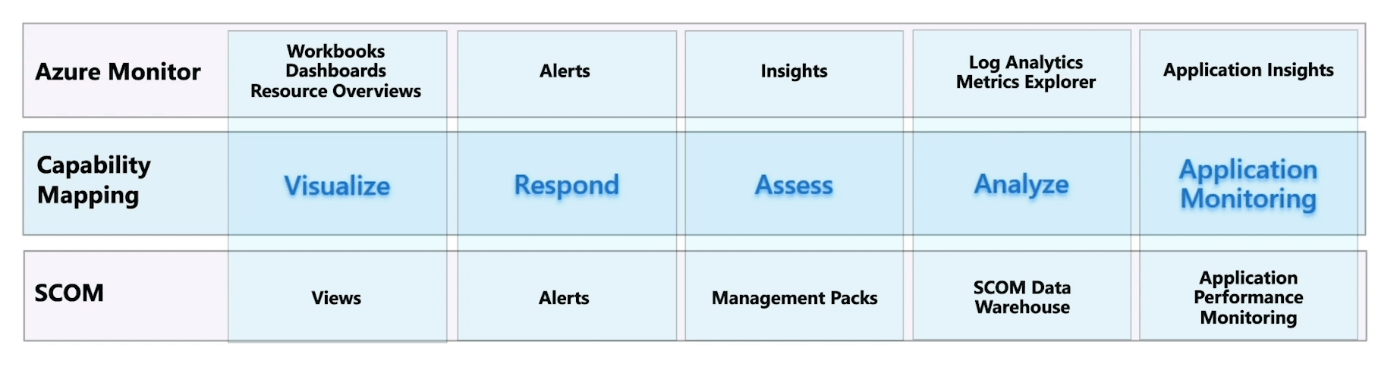
Comparing Azure Monitor with Operations Manager (courtesy of Microsoft)
Back in 2015, Microsoft released OMS, Operations Management Suite, designed to be a SaaS-based alternative to SCOM, removing the burden of managing your own infrastructure to house your monitoring. It had Solutions for monitoring Active Directory replication for instance, along with 20+ other ones. Today OMS doesn’t exist, but you’ll see the name crop up in blog posts, documentation, and agent configuration names. Solutions are still available, both from Microsoft and third parties but the Microsoft ones aren’t actively maintained.
Its replacement is Azure Monitor which has a slightly different aim.
Azure Monitor
Azure Monitor is designed to be the single place for monitoring all your Azure IaaS and PaaS services, along with your own applications and code while also being able to extend to on-premises resources as well as resources in other clouds. Azure Monitor builds on top of Azure Log Analytics, the platform service that gathers log and metrics data from all your resources. The easiest way to think about Azure Monitor vs Log Analytics is that Azure Monitor is the marketing name, whereas Azure Log Analytics is the technology that powers it. To (try to) clarify this for customers, Microsoft has started to refer to Azure Log Analytics as Azure Monitor Logs instead.
The basic building block is a workspace, which lives in one region in Azure. It’s an administrative boundary, with a daily data ingestion cap, a specific charge plan, and retention settings (you can, however, have different retention for different data in the same workspace). Microsoft recommends having as few workspaces as possible (1-3) but there are reasons to split data such as regulations where data has to be kept in certain geographical regions, latency concerns, or autonomy of IT teams in different parts of the world.
To provide access to data there’s a rich Role Based Access Control (RBAC) model to manage access to each workspace. Unique to Azure Log Analytics, there’s also the option to base telemetry access on the fact that someone has access to the workload. So, if you have permissions to manage four VMs (and no others), you’ll also automatically have access to their telemetry but no logs from any other resource. This is turned on by default for new workspaces created after March 2019 and you can turn it on for older workspaces under Properties – Access control mode; “Use resource or workspace permissions” and then remove general workspace access permissions.
Azure Monitor differentiates between metrics, something that has a count of a particular value with very little additional data attached, such as packets per second or CPU percentage, and logs, which carry more details and are more verbose. The time it takes for data to flow into Azure Monitor, and thus for your alerts to kick off if something isn’t right, varies between workloads but is much shorter for metrics than for logs. Another way to look at it is to rely on metric alerts to tell you that something isn’t behaving as it should and logs let you investigate why it’s happening.
Once you have the data in Azure Monitor you use Kusto Query Language (KQL) queries in Azure Log Analytics to understand what’s going on and alerts to let you know (email, text message, push notification in the Azure app, phone call as well as integration with your IT services platform) when something’s amiss. Alerts rely on Action groups to define what action to take which can also include running Automation Runbooks, Azure Functions, or a Logic app as well as connecting to a webhook endpoint. Note that queries can span several workspaces if required.
To give you a head start Azure Monitor offers Insights, a curated list of pre-prepared queries, visualizations, and dashboards that also contain Workbooks that provide deeper insights into your data, helping you with investigations and understanding your infrastructure.
How to Enable Log Analytics in Azure
If you have a larger environment, some planning needs to be done upfront to ensure success with Azure Monitor. You need to have a strategy (what workloads do we have, what needs to be monitored, what’s business-critical, what are the different SLAs we need to adhere to for uptime/remediation of issues), figure out your architecture (how many workspaces, in which region, who has access), onboarding at scale (using ARM templates, Azure Policy and Azure Arc), automating actions and remediations and plan for ongoing optimization (retention settings, etc.).
In a larger deployment (ingesting 1TB+ per day) you can opt for Dedicated Clusters, which in turn unlocks features such as Lockbox for managing Azure support engineer access to your cluster, Customer-managed keys, and Double encryption to ensure you have complete control over the encryption for the data that’s in Azure Monitor Logs. They’re also good for Multi-workspace scenarios as the performance will be better if all the data lives on the same cluster.
Azure Monitor is designed to handle any scale workload from a trickle of log data to massive amounts of data, but Microsoft does ask you to contact them if you’re expecting to ingest “more than a few TB a day” so they can ensure adequate capacity is available.
Take a good look at how billing works (volume of data, which plan you’ve selected, and data retention) and if it makes sense to pick a Capacity Reservation plan where you pay for a set amount of data as well as if you should implement a Daily Cap to limit the amount ingested per day.
If network security is a concern, consider using Private Link to make sure your traffic stays on Azure’s backbone network with no public network access, and if you’re using ExpressRoute, secure on-premises network traffic as well.
Part of your deployment plan includes enabling monitoring for PaaS resources as well as deploying agents for IaaS (and on-premises / third party cloud) VMs. True to form Microsoft offers several agents, with the current Azure Log Analytics agent on Windows and the Telegraf agent for Linux being replaced by the new Azure Monitor agent on both platforms, currently in preview.
In the past, you had to define what data to gather on an individual resource basis but now (at least for VMs, additional resources are coming) you can use Data Collection Rules to define what you want to monitor, and it will apply across an entire scope.
Network Monitoring
A cornerstone of monitoring is understanding how clients and servers are connected, how the data flows between them, what the latency and throughput looks like, and when there are issues.
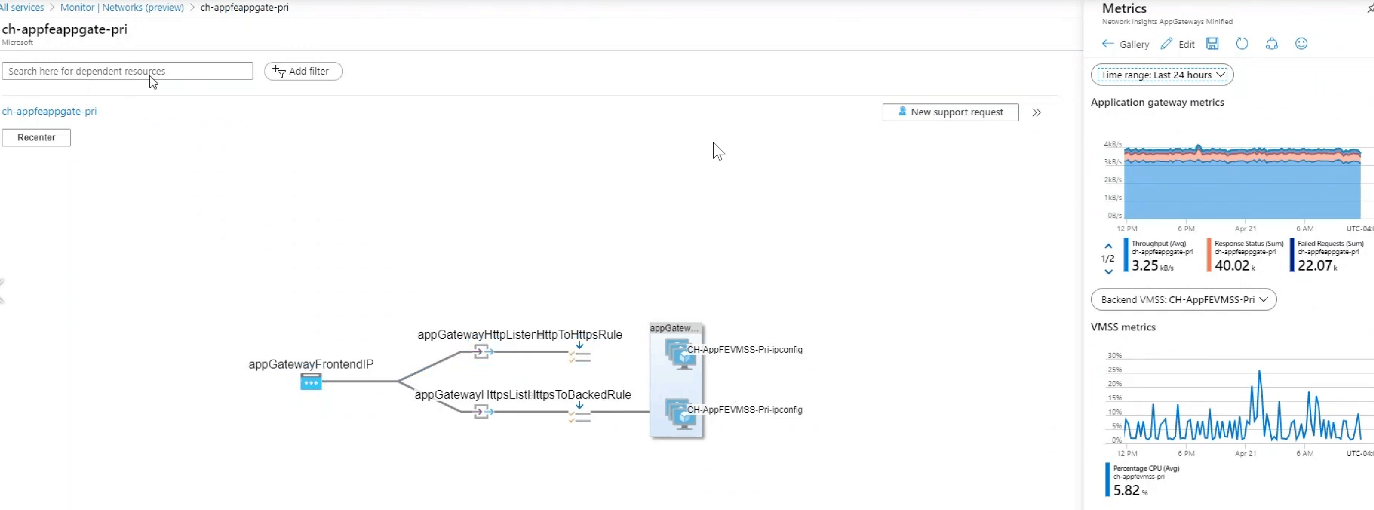
Azure Network Monitor Dependency View (courtesy of Microsoft)
Version 2 of the network monitoring component of Azure Monitor covers all network components (with no agent deployment required for Azure cloud monitoring) such as vNets and subnets, ExpressRoute, VPN, and performance, along with giving you a Traffic view and a Diagnostics toolkit for troubleshooting. This latter feature gives you links to enable packet capture for VMs, troubleshooting VPNs, troubleshooting connectivity issues, identifying next hops, and diagnosing traffic filtering issues.
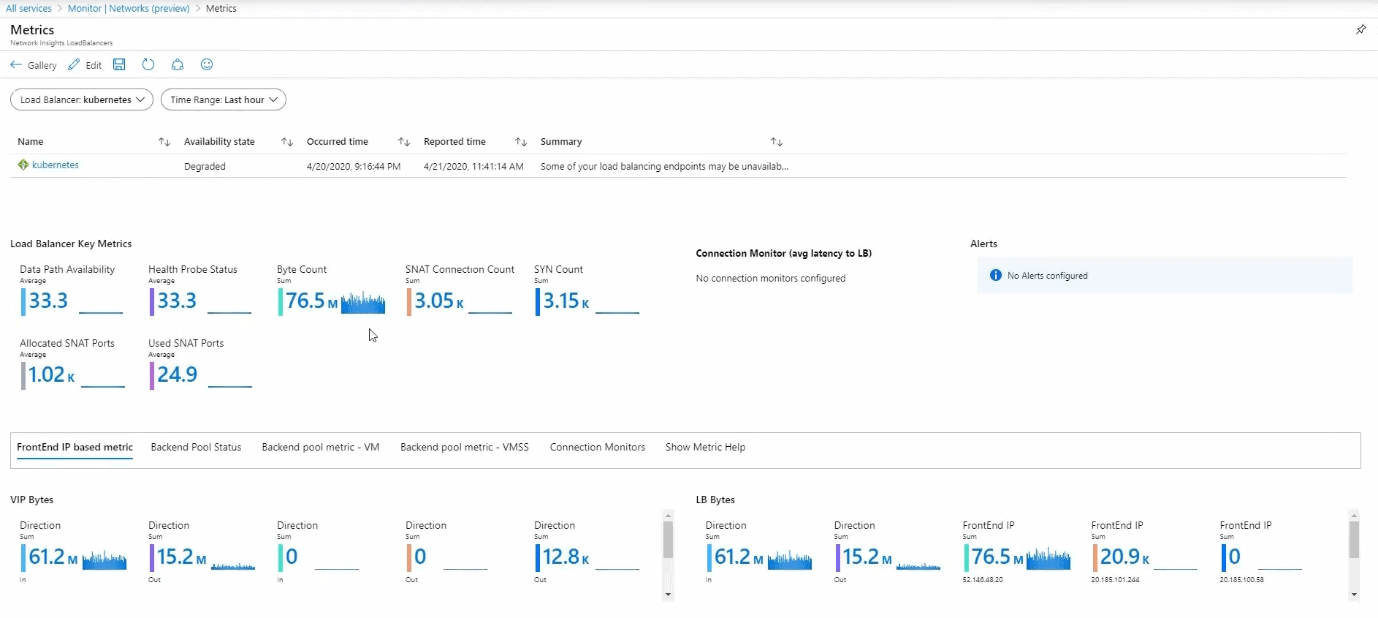
Azure Network Monitor Load Balancer (courtesy of Microsoft)
There are also solutions for DNS monitoring and keeping tabs on Application Gateway, a PaaS service you put in front of your web apps to protect them, along with Network Performance Monitor.
Insights
At the time of writing, there are 16 Insights on offer (the closest you’ll get to a SCOM MP). Virtual Machines, Containers, Networks, Storage accounts, Backup, Cosmos DB, Cache for Redis, Data Explorer Clusters, Log Analytics workspaces, Key Vaults, Applications, Activity Logs, Service Bus, SQL, Azure/Windows Virtual Desktop and Azure Stack HCI.
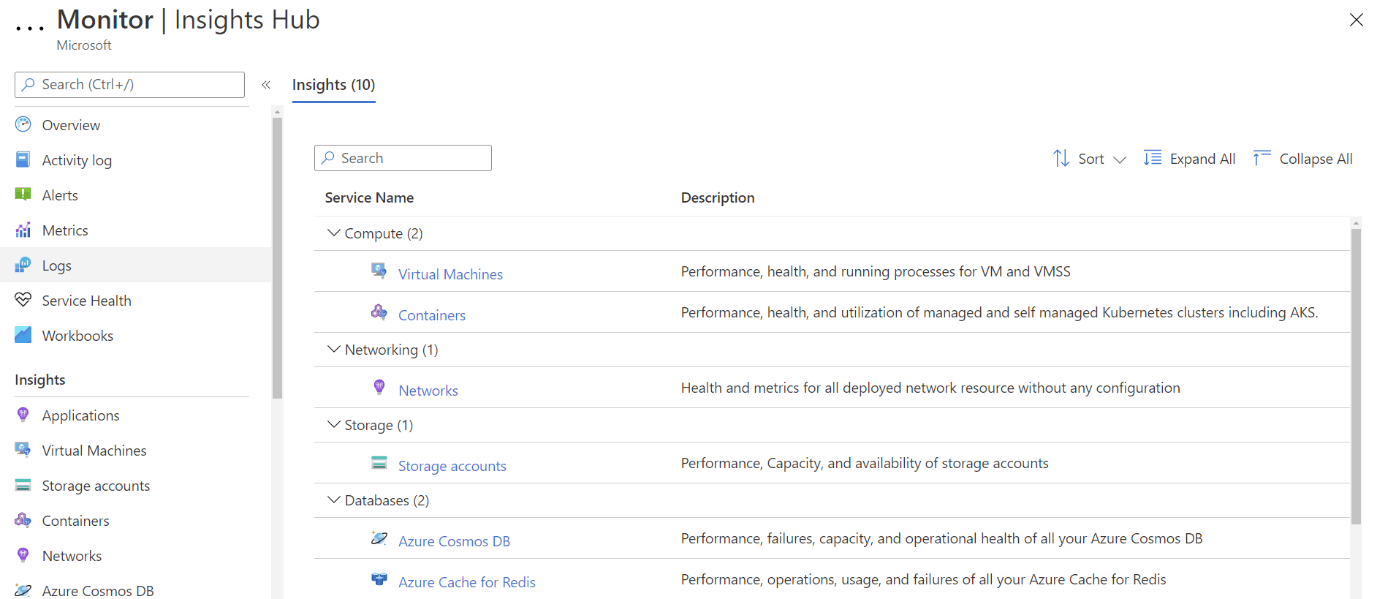
Azure Monitor Insights Gallery
Virtual Machine monitoring
The Virtual Machine Insights works for both VMs and VM Scale Sets (VMSS, groups of identical VMs that can scale up and down based on load) and the new VM map builds on the older Service Map solution.
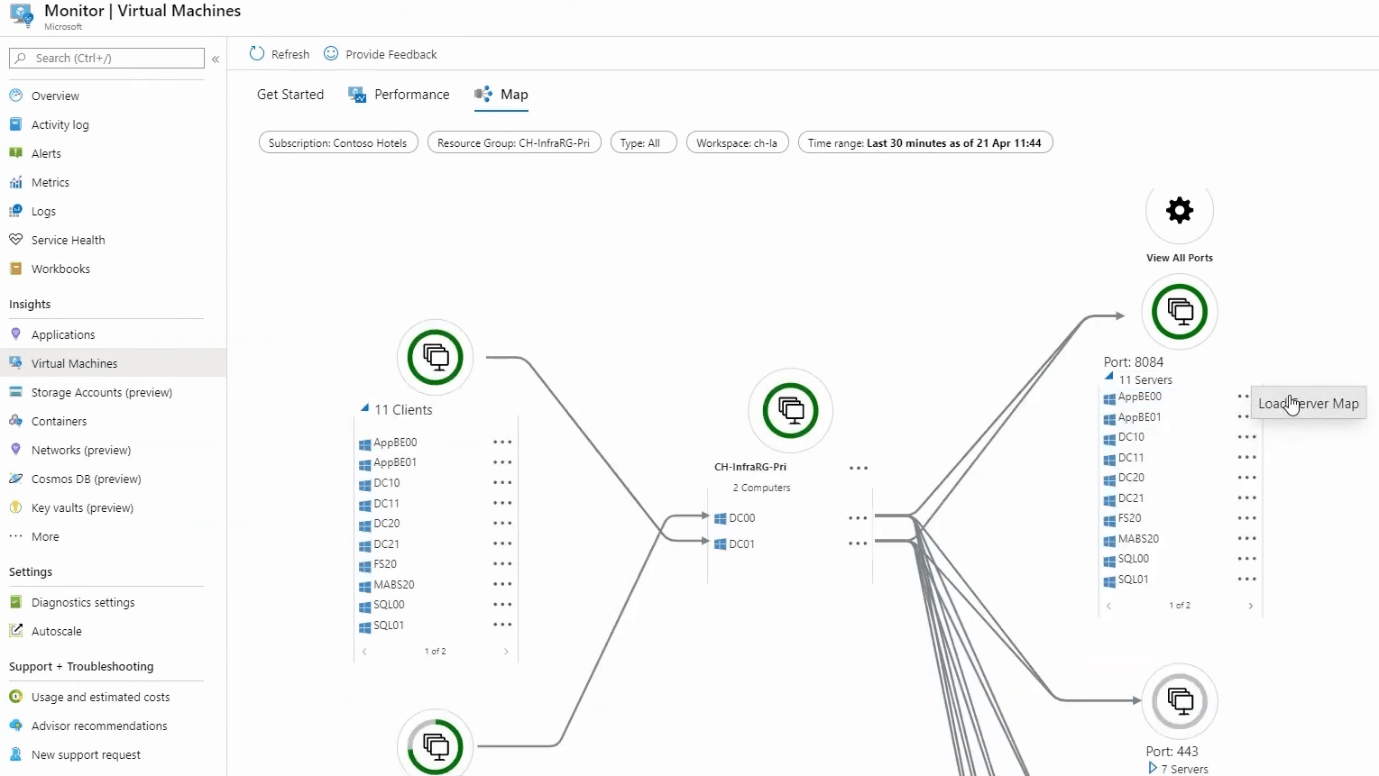
Azure Monitor Virtual Machine Map (courtesy of Microsoft)
The top N charts are a great way to get an overview of which of your VMs are busiest by providing charts for the top five VMs by CPU usage, available memory, logical disk space and bytes sent/received. This Insight also provides a VM Utilization workbook with a useful option for colour code usage across a fleet of VMs.
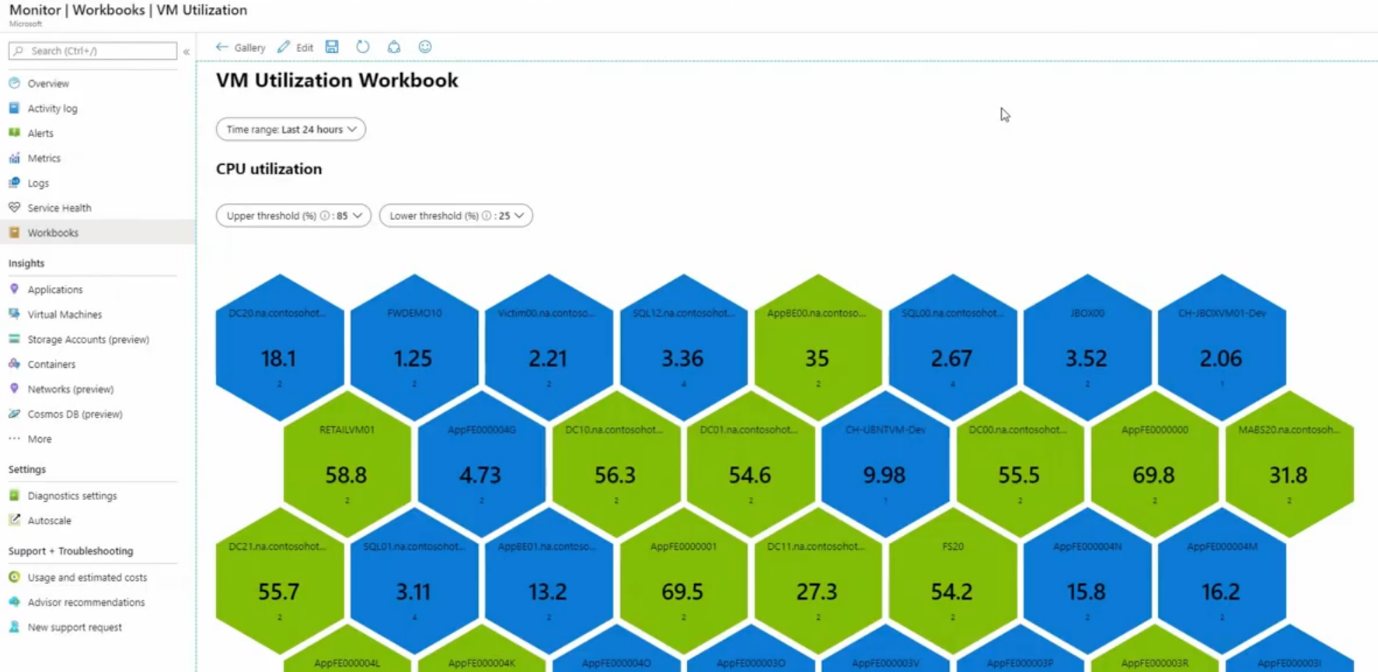
Azure Monitor VM Utilization workbook (courtesy of Microsoft)
There has been mention of supporting workloads inside VMs such as MySQL but that hasn’t materialized, yet, but the new Insight for SQL Server supports VMs with that workload and if you’re running Azure SQL DB (the PaaS offering), there’s full support for it.
Application Insights
One of the 16 insights in Azure Log Analytics is App Insights, Microsoft’s Application Performance Management (APM) solution, which monitors your custom applications. Fairly new here is the ability to integrate this monitoring into the same workspace as your platform and infrastructure monitoring, giving you a holistic view to identify where a performance issue lies.
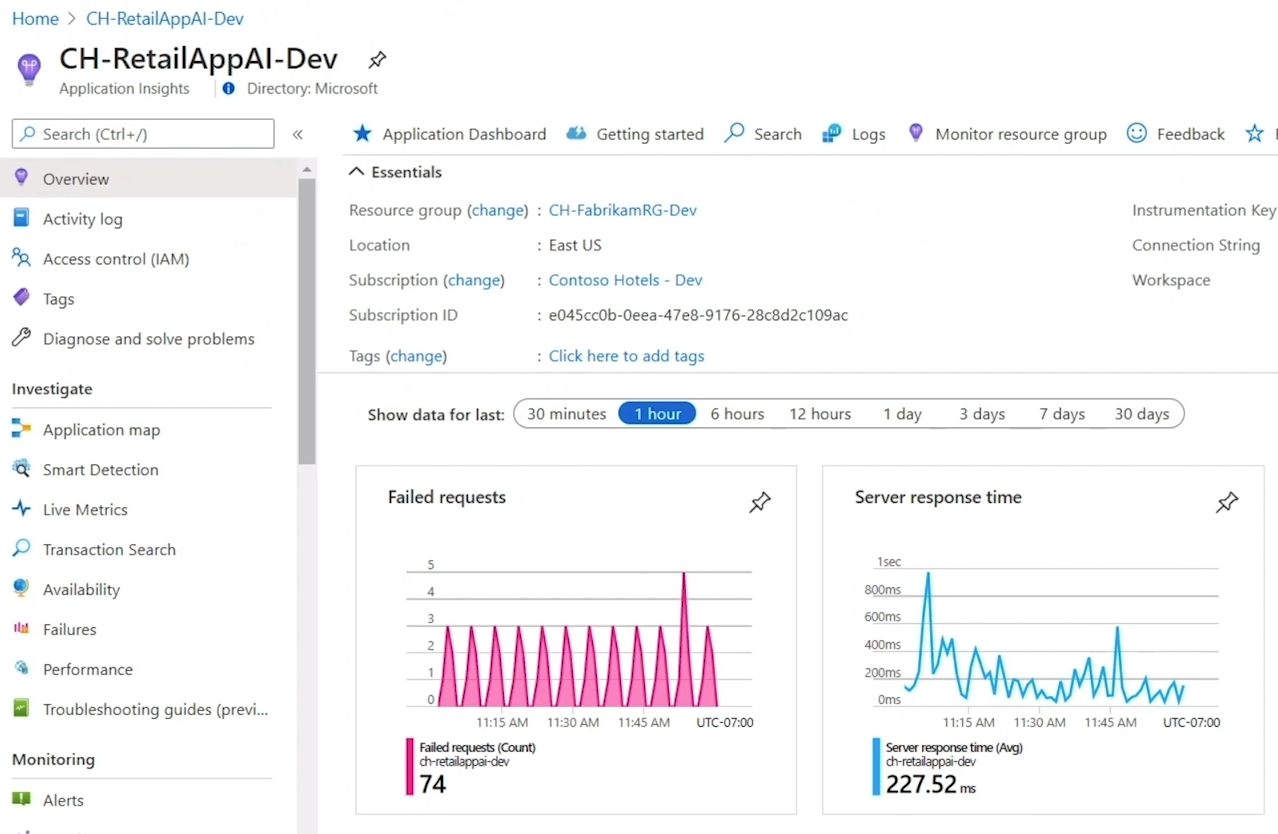
Azure Monitor Application Insights Dashboard (courtesy of Microsoft)
App Insights support .NET, Java, Python, Node.js, iOS, Android, and React apps wherever they may run (on-premises, hybrid, any public cloud), either through an instrumentation package in your application or by deploying the Application Insights Agent in your Azure VMs and VMSS, Azure App Services, Azure Functions or Azure Cloud Services.
It gathers request rates, response times, failure rates, and the same for external dependencies, along with exceptions, page views, and load performance, AJAX calls, user and session counts, performance counters (both Windows and Linux), host diagnostics from Docker or Azure, along with diagnostics trace logs from your app. If you’re tracking a current issue you can use Live Metrics Stream to see metrics with about a one-second latency as you’re applying fixes or tracking down the exact line of code that’s causing the issue.
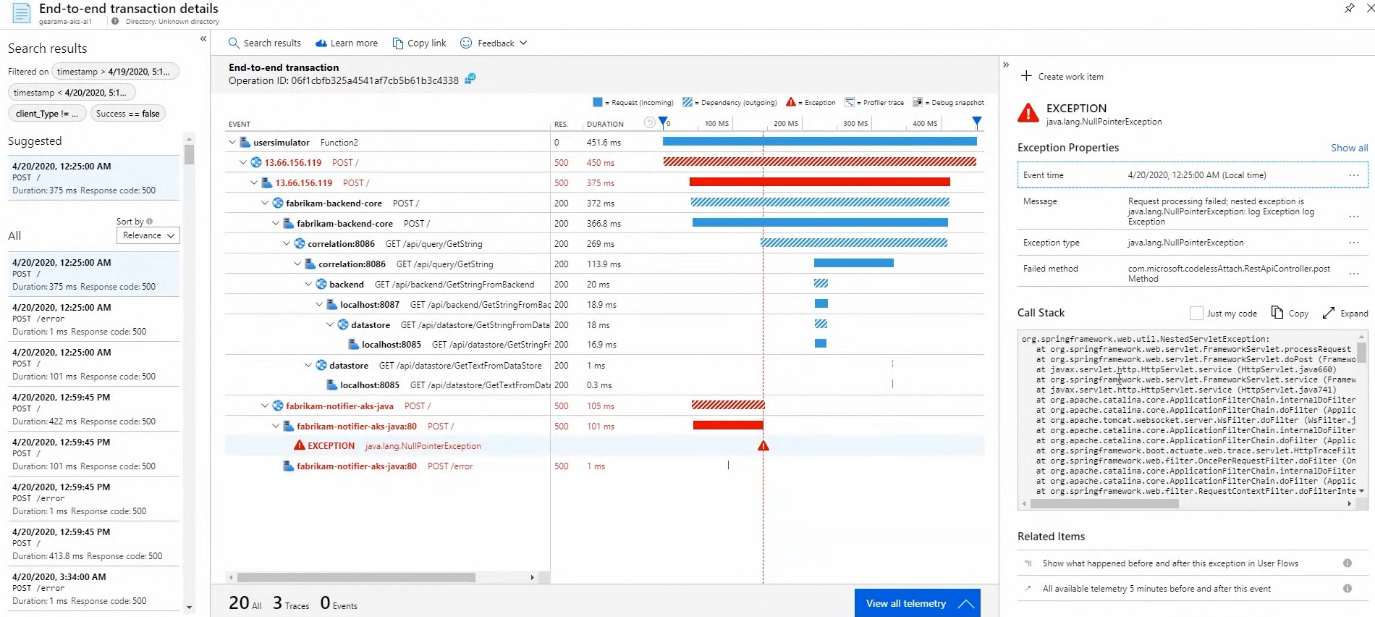
Azure Monitor Application Insights Transaction View (courtesy of Microsoft)
To assist you in managing large applications use Smart Detection which uses Machine Learning (ML) to identify performance and failure anomalies in your applications without you having to write explicit rules.
Apart from informing you about failures and performance issues, App Insights also gives you data about your application’s usage. Demographics data is available such as when people are using the app, which pages are most popular, where the users are coming from and what browser and OS they run. Retention gives you insight into which users return to your app, whereas Funnels track your customers as they progress through multistage experiences in your app to see where they drop off. To understand how your users are progressing through your application from page to page, use the User Flows visualization tool. You can group users, events, operations, or sessions together into Cohorts to explicitly track a specific set of users or events repeatedly. If you’re looking to see if different page load times influence usage use Impact. And as you try out different versions of your app through A/B testing, App Insights can help you identify which version is most popular, performant, or impactful.
All of this information can be seen at a glance in the new Application Insights Overview dashboard or if you need to see how different components of your distributed application are connected and how each of them is performing, use Application Map.
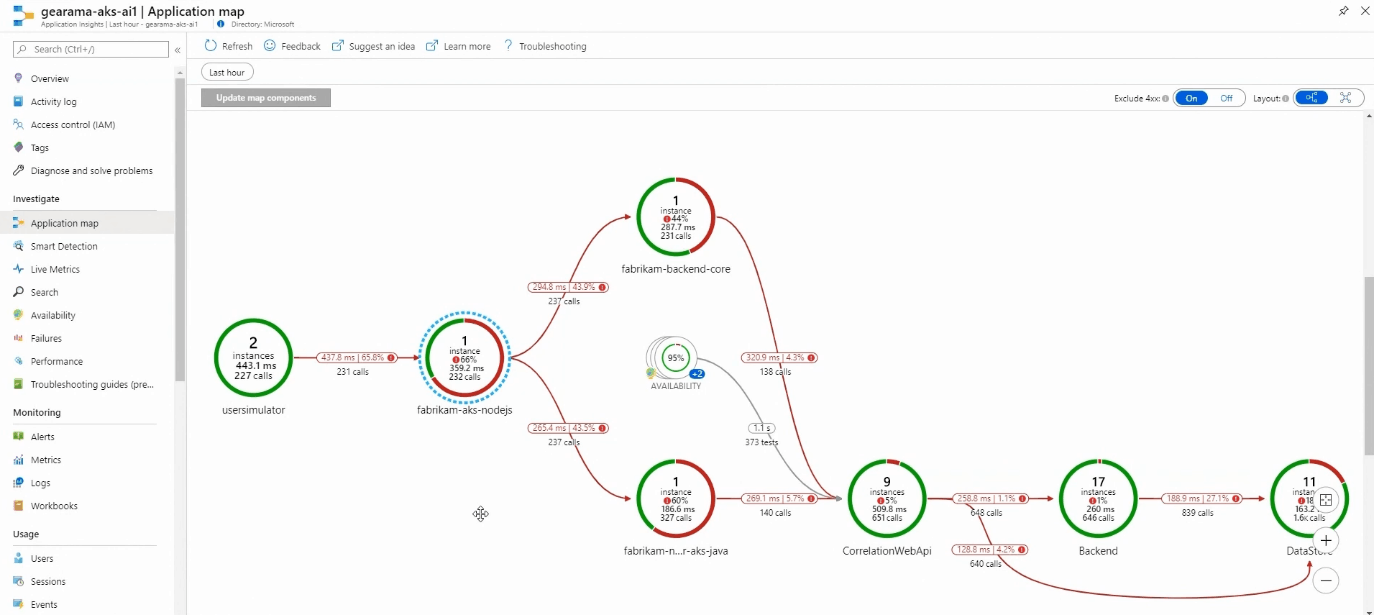
Azure Monitor Application Insights Map (courtesy of Microsoft)
Container Monitoring
Given the strong focus from Microsoft on Azure Kubernetes Services (AKS) as well as Kubernetes in general (Arc for K8S), it’s no surprise that there’s Azure Monitor for containers. It covers AKS, self-hosted Kubernetes clusters in Azure using AKS Engine, Azure Container Instance (ACI), Azure Red Hat OpenShift and Azure Arc enabled Kubernetes.
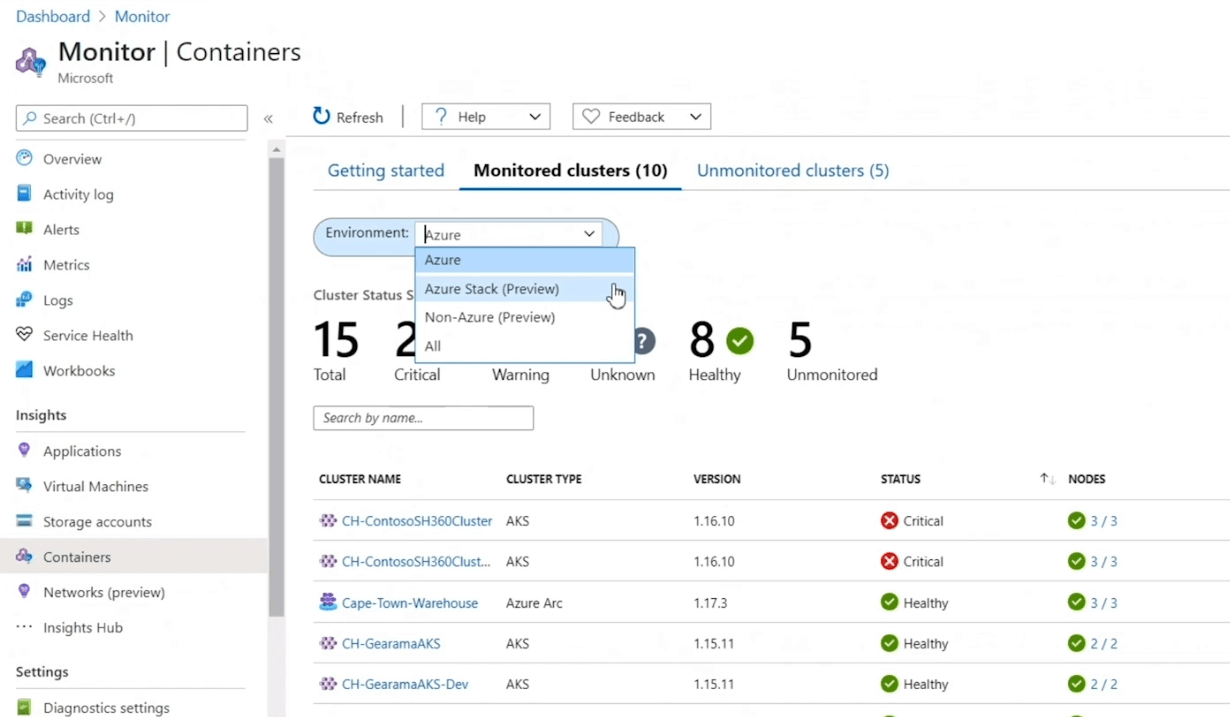
Azure Monitor Container Monitoring (courtesy of Microsoft)
This Insight shows you which containers are running on each node, along with average CPU and memory usage for AKS, and for ACI it tracks processor and memory utilization for container groups and containers. This lets you understand the behavior of the cluster under both average and heavy load, assisting in your capacity planning. You can set up alerts for CPU and memory usage thresholds and for health state changes. It also integrates with Prometheus and Kube state and Network Policy Manager metrics are gathered. It comes (as does several other Insights) with recommended metric alerts to help you get started.
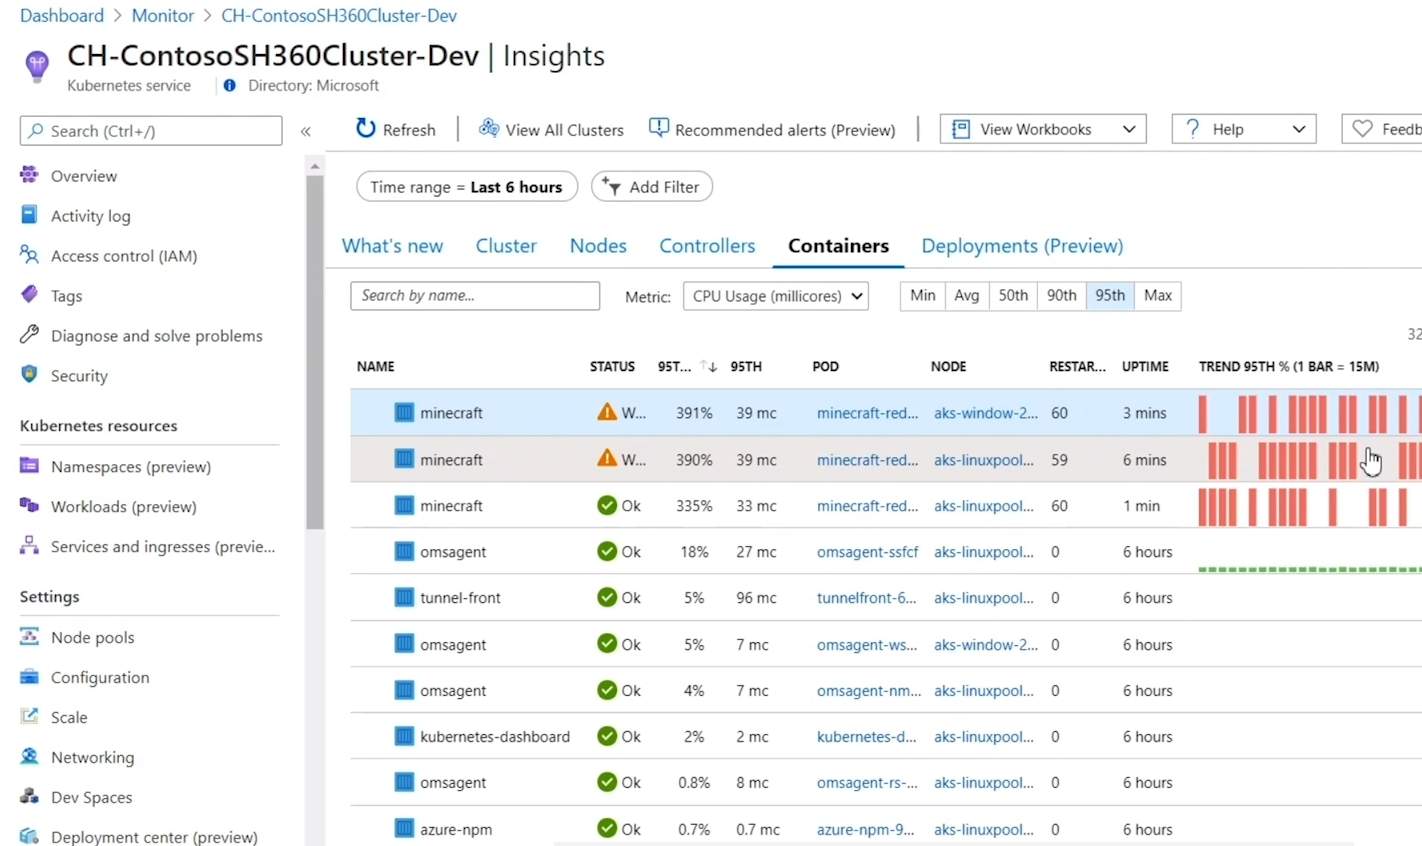
Azure Monitor Container Node Monitoring (courtesy of Microsoft)
Other Azure Resources
Azure Key Vault is a service in Azure used to store secrets, passwords, connection strings, and other sensitive information which can either be backed by software or by a Hardware Security Module (HSM). Azure Monitor keeps tabs on your Key Vaults (up to 200) by giving you a unified view of requests, performance, failures, and latency. There are Overview and Failures workbooks with visualizations that track status codes.
If you’re using the Azure Cache for Redis service this monitoring tracks data such as used memory, CPU, number of connected clients and errors as well as Cache read/write/hits and misses.
Cosmos DB isn’t left out in the cold with monitoring for performance, failures, capacity, and operational health.
The ability to monitor Azure Virtual Desktop, the solution is still called Windows Virtual Desktop (surely one of Microsoft’s best-timed service releases ever).It monitors your hosts in your pools for both performance telemetry and event log data.
Monitoring for SAP, both SAP on Azure VMs and SAP on Azure Large Instances is available. It covers both the SAP HANA database and SQL Server, is Open Source, and like all the other Insights – is available at no cost.
Alerts and Automation Workflows
Once you have deployed Azure Monitor with the right number of workspaces and have deployed agents / enabled telemetry for PaaS services and have configured the Insights and Solutions you need, it’s time to set up alerts and automation workflows.
As mentioned, alerts can be configured to notify you in many different ways, particularly powerful are the connectors to Logic Apps and Power Automate Actions. Alerts can be based on either Metrics or Log data or on Azure Activity log data, actions taken in the Azure control plane on your Azure resources (resizing a VM for instance). There are also many third-party integrations for Azure Monitor, including the recent ITSM connector for BMC Helix.
The challenge (and promise) of a well-configured monitoring system is to set up automation, not only to alert you when something is out of the ordinary but also to have remediation steps for basic problems. Did a service in Windows terminate unexpectedly? Run automation to restart it, try twice, and only alert me if this also fails.
Newer features include being able to set up Alert rules on Custom Metrics even before they’ve started being collected. You can also combine multiple AND conditions in a single alert rule and my particular favorite, the ability to create an alert from a KQL query. The Linux agent can be multi-homed, so it sends telemetry to different workspaces. And you can filter Windows event logs using XPATH queries.
We’ve already covered Workbooks and Dashboards for visualization of health states and data but if you need even more capabilities you can send data to Power BI or Grafana.
Also, in the preview is Azure Log Analytics Query Auditing, which is the ability to see when a query was run, who ran it, using what tool and the text of the query itself as well as performance statistics. It’s useful in large environments where knowing which administrators are doing what is often required by regulations.
Azure Arc
Azure Monitor isn’t just about workloads in Azure, it can be extended to on-premises, and VMs running in other clouds. For servers, this has been available for a few years and simply involves installing the agent in a Windows or Linux VM or physical server and pointing it to the right Azure Logs Analytics workspace. Microsoft’s new take on a hybrid is Azure Arc which extends much further than Azure Monitor. Azure Arc enabled servers (generally available) bring a representation of them into the Azure portal and let you manage them with Azure Policy etc. In preview is Azure Arc enabled Kubernetes and Azure Arc enabled SQL server. The container monitoring described above for instance extends to your Kubernetes clusters wherever they may run.
Finally, Azure Monitor also supports Azure Lighthouse which lets a service provider manage monitoring as a service for their clients, once they’ve been provided delegated access.
Conclusion
It’s noteworthy that another fast-growing service from Microsoft, Microsoft Sentinel, is built on top of Azure Log Analytics workspaces so it’s not only a powerful monitoring solution in its own right but also a platform for other services.
Azure Monitor is not SCOM, the level of detail and work involved in setting it up is different and it’s definitely designed for a cloud environment, not traditional on-premises IT. If you already have a tuned deployment of SCOM (or a third-party monitoring solution) for your on-premises infrastructure, don’t expect Azure Monitor to replace it, but when it comes to keeping an eye on your cloud infrastructure, it’s the best solution for you.
Azure Monitor is an area of focus for Microsoft with many new features coming out regularly. If you’re deploying resources to Azure, monitoring is essential so make sure you upskill using Azure Log Analytics.


Not a DOJO Member yet?
Join thousands of other IT pros and receive a weekly roundup email with the latest content & updates!
Frequently Asked Questions
What is Azure Log Analytics?
What is the difference between Azure monitor and Azure Log Analytics?
How do I read data from Azure Log Analytics?
Is Azure Log Analytics free?
How do I Monitor my Azure monitoring costs?
More in this category


About the Author
Paul Schnackenburg

