Save to My DOJO
Table of contents
In Part 1, we learned how to set up Nagios Core on CentOS 7. In this second installment, I’ll be adding a python script thanks to which we can monitor ESXi for hardware issues in an effort to prevent unplanned downtime. To test it out, I’ll be including a few ESXi hosts, physical and nested, as my monitoring subjects. While I’m at it, I will also cover host groups and how to configure Nagios for email notifications.
As I mentioned in Part 1, there are a few plugins out there written specifically for ESXi and vCenter Server monitoring. You’ll find these listed on Nagios Exchange.
Today, I opted for the check_esxi_hardware Python script, the details for which are available here. Credit also goes to the author of this video which pretty much narrates the procedure outlined below.
A few requirements
On the ESXi host …
To monitor ESXi hardware, CIM must be enabled and running on the host. To check if CIM is enabled, simply telnet <ESXi IP address> 5989. A successful connection means that CIM is running unless some other service is using the same port. If the connection fails, check your firewall rules including the ones specified for the ESXi firewall. As shown next, make sure to enable the two CIM ESXi firewall rules from vSphere Web client or Host client.
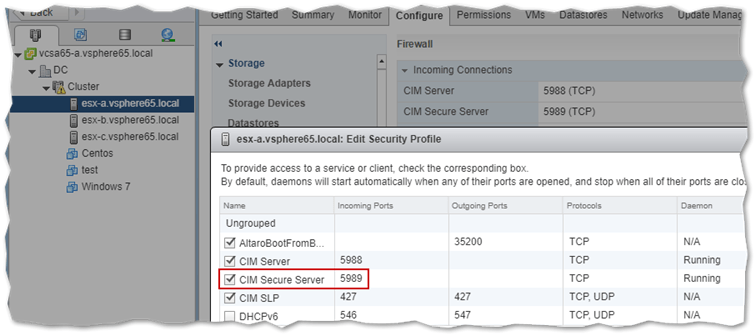
CIM must be enabled as is the respective firewall rule and network ports
If you still cannot connect to 5989, SSH to ESXi and run ./etc/init.d/wsman status. If an “openwsman is administratively disabled, enable sfcbd” message is returned, run the following esxcli command to enable wbem.
esxcli system wbem set --enable true
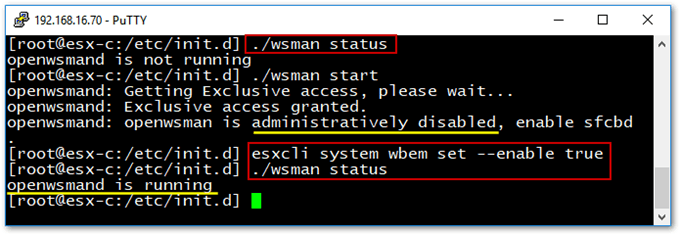
Enabling WBEM services using esxcli
For further information, have a look at KB1025757.
On the Nagios server …
The following packages must be installed on the Nagios Core server. This includes the mailx email client, used to send out email notifications.
yum install python-pip
yum install pywbem
yum -y install mailx
Next, we need to download check_esxi_hardware Python script. Run the following commands on the Nagios Core server.
cd /usr/local/nagios/libexec/
wget https://www.claudiokuenzler.com/nagios-plugins/check_esxi_hardware.py
chown nagios:nagios check_esxi_hardware.py
chmod 755 check_esxi_hardware.py
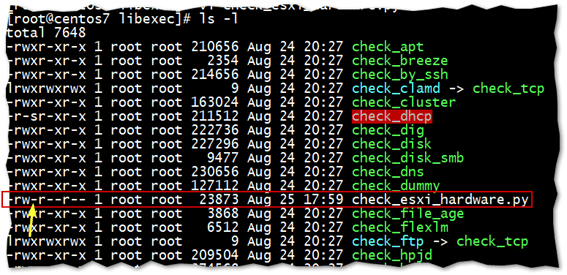
When copied, the python script will be missing execute permissions
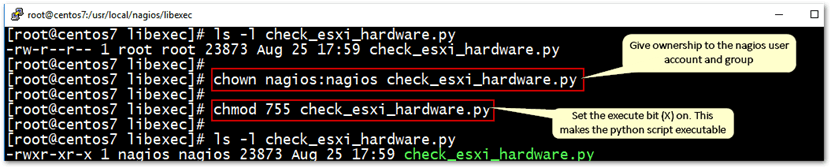
Changing ownership and setting file permissions on the python script
Let’s test if the script works. Select an ESXi host and run the script as follows.
check_esxi_hardware.py -H <ESXi IP Address> -U root -P <root password>
Nothing is returned if the script fails to find any issues. If it does find something wrong, the status information picked up by the CIM sensors is returned as per the next example. In this case, the physical server running ESXi, had its lid removed and put back at some point but the sensor was not reset.
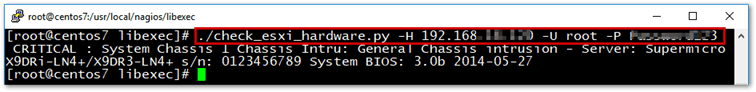
Test running the check_esxi_hardware script against a physical ESXi box
Using the vSphere Web Client or the ESXi host client as shown next, we can confirm that the information returned by the script is indeed correct.
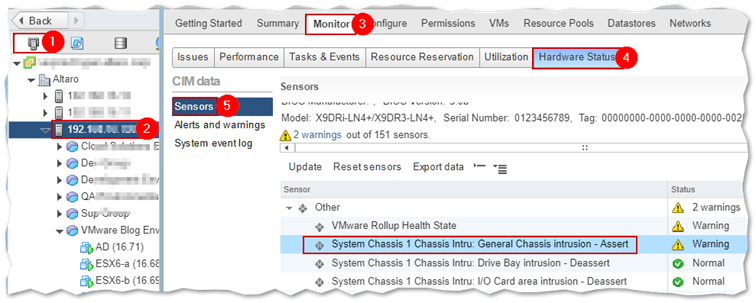
Using vSphere Web client to view the Hardware Status of ESXi
Configuring Nagios
Let’s get down to the meat of actually configuring Nagios. These are the four configuration files in total that you need to know about.
- /usr/local/nagios/etc/nagios.cfg
- /usr/local/nagios/etc/objects/commands.cfg
- /usr/local/nagios/etc/objects/contacts.cfg
- /usr/local/nagios/etc/objects/esxi.cfg
The first 3 are default configuration files. The fourth, esxi.cfg, is something you will need to create, so let’s start with it first.
1. ESXi.cfg
First, make a copy of /usr/local/nagios/etc/objects/local.cfg. Carry out the following:
cd /usr/local/nagios/etc/objects
cp local.cfg esxi.cfg
The local.cfg file is the object definition file for the Nagios server itself. We use this as a template for our ESXi hosts. An object definition file contains information about the objects, in this case the ESXi hosts we want to monitor. Optionally, we can create a host group section along with the host and service definition sections.
Using this configuration, I’ll be monitoring 2 ESXi hosts; esx-a and esx-b. I’ll be running a ping check along with the Python script. The latter takes 3 parameters; the root account, root password and hardware type which you can set to auto. Here’s a brief rundown of the file sections used.
Host Group – A host group definition consists of the group name, an alias and the objects you want as members of the group. The name of the objects included must match that specified in the host definition for each.
Host Definition – A basic host definition includes a template, a name and an alias for the object being monitored and most importantly an IP address.
Service Definition – This consists of a services template defined by use, the name of the object against which the service is run (this should match the name in the object’s host definition), a service description and the command associated with the service including a list of mandatory command-line parameter values. The command gets executed against an object if the corresponding service is enabled.
#Hostgroup Definitions
define hostgroup{
 hostgroup_name nestedESXi
 alias All nested instances of ESXi
 members esx-a,esx-b
}

#Host Definitions
define host{
 use linux-server
 host_name esx-a
 alias esx-a
 address 192.168.16.68
}

define host{
 use linux-server
 host_name esx-b
 alias esx-b
 address 192.168.16.69
}

#Service Definitions
define service{
 use local-service
 host_name esx-a
 service_description PING
 check_command check_ping!100.0,20%!500.0,60%
}

define service{
 use local-service
 host_name esx-b
 service_description PING
 check_command check_ping!100.0,20%!500.0,60%
}

define service{
 use generic-service
 host_name esx-a
 service_description ESXi Hardware Check
 check_command check_esxi_hardware!root!password!auto
}

define service{
 use generic-service
 host_name esx-b
 service_description ESXi Hardware Check
 check_command check_esxi_hardware!root!password!auto
}
2. Commands.cfg
The commands.cfg configuration file contains definitions for the commands used by Nagios to monitor objects. We need to add a reference to the check_esxi_hardware script along with the parameters passed along. Here’s how I set it up:
# 'check_esxi_hardware' command definition

define command{
 command_name check_esxi_hardware
 command_line $USER1$/check_esxi_hardware -H $HOSTADDRESS$ -U $ARG1$ -P $ARG2$ -V $ARG3$
}
The definition listed can be placed under the section shown in the next screenshot. Use the vi editor to accomplish this.
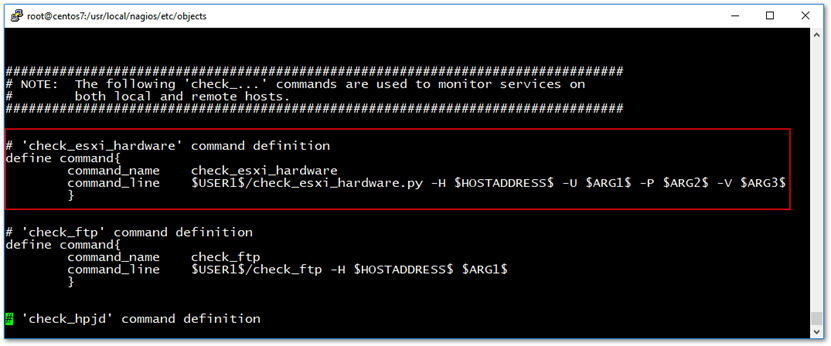
Adding a command definition for the python script to commands.cfg
3. Nagios.cfg
This is, as you’ve probably guessed, the main configuration file for Nagios which is where you’ll find the core settings for the product. At this point, we need to add a reference to the esxi.cfg previously created so Nagios can start monitoring the ESXi hosts in it defined.
To do this, we add an object configuration file entry right at the beginning of the nagios.cfg file as shown next.
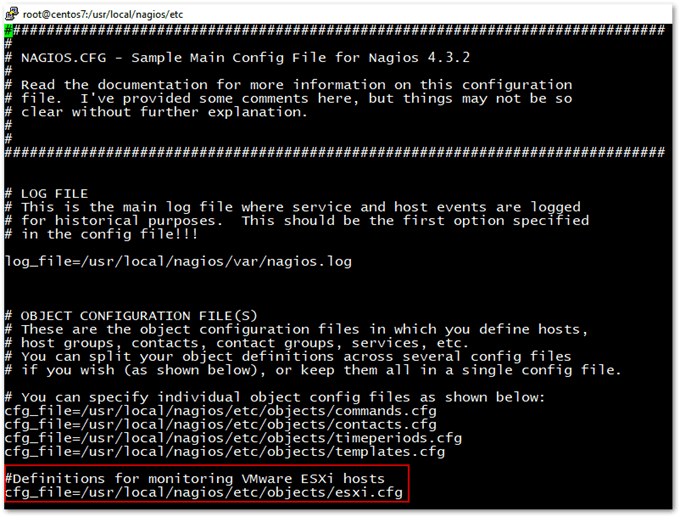
Adding the ESXi hosts definition file to Nagios’ main configuration file
4. Contacts.cfg
If your CentOS VM is already configured to send out emails, you just need to change the email entry found at the beginning of contacts.cfg file. This enables you to receive email notifications from Nagios.
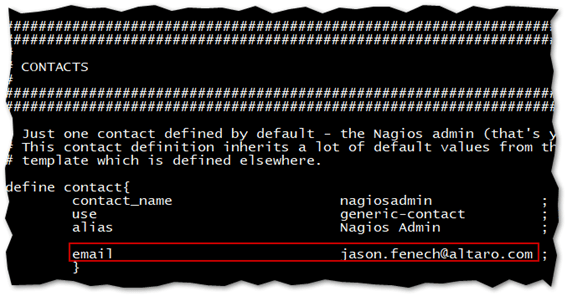
Setting the default email recipient for email notifications
In my case, I only had to install mailx for this to work. If it doesn’t work straight out-of-the-box for you, have a look at this and this. The only thing left to do is restart the Nagios service. Do this by running:
service restart Nagios
Start monitoring
Using a browser, log in to access the Nagios console. On the right-hand side, click Hosts. You should see the ESXi hosts specified in esxi.cfg.
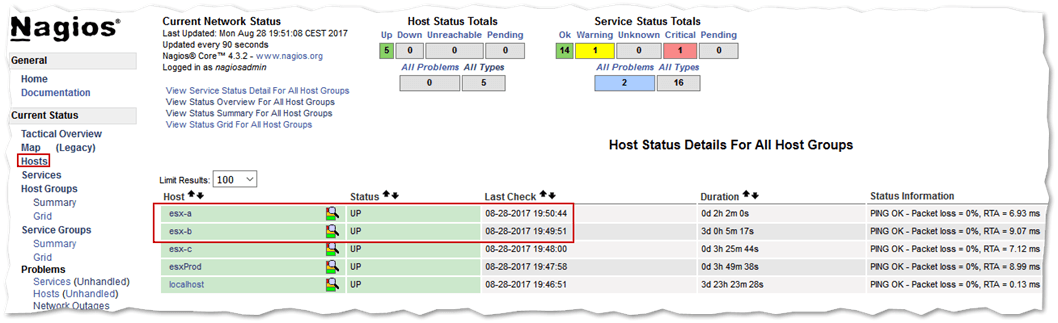
Nagios Core Hosts view
Clicking on a host link will take you to the Host Information page displaying host state information. You can also enable and disable various checks and settings from the Host Commands list. Enabling email notifications for a specific object is one such example.
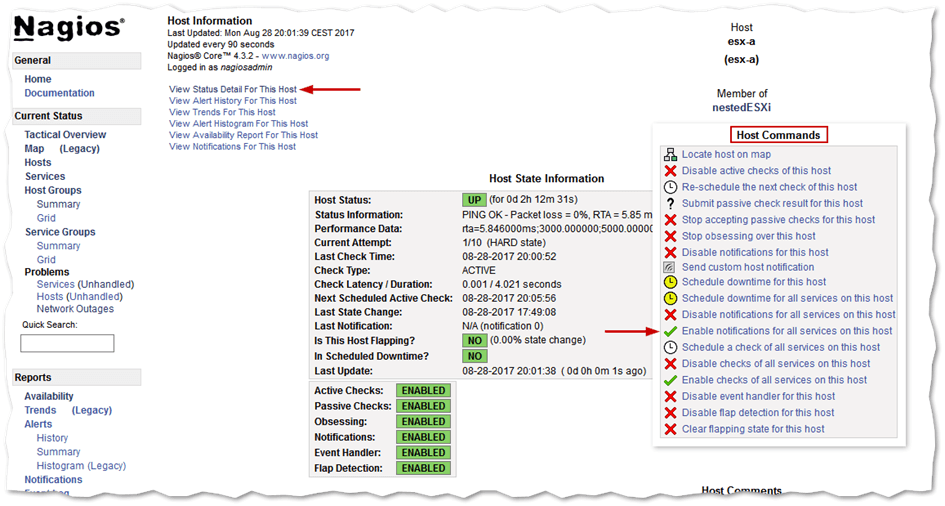
The host information page gives you an overview of the object’s state and enabled checks
Clicking on View Status Detail For This Host (previous screenshot) takes you to a page displaying which services are defined for the object being monitored. As can be seen in the next screenshot, these correspond to the ping and ESXi Hardware Check services defined under the Service Definitions section in the esxi.cfg file.
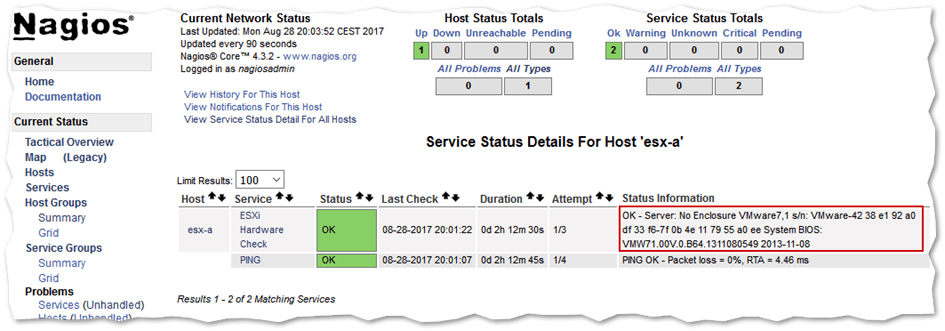
You can check which services are monitoring an object along with any status information returned
Clicking on Host Groups takes you to a page where monitored objects are ordered according to the host groups they are members of. So, returning to our example, you can see a nestedESXi host group which was defined in the esx.cfg configuration file.
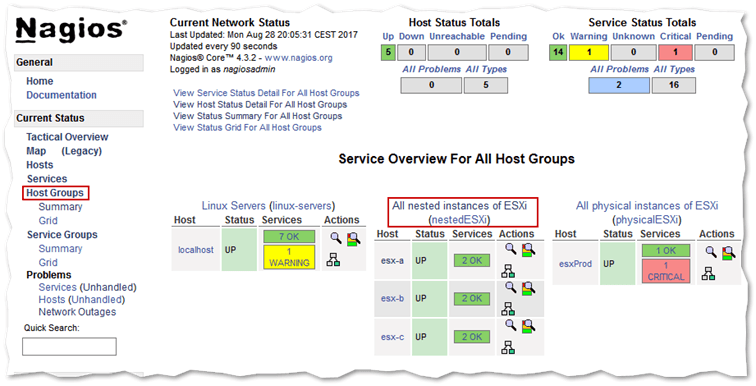
Grouped monitored objects
And finally, provided email notification for a selected object is enabled, you should start receiving email notifications whenever a service reports back something faulty. The screenshot shows two overlaid email messages, one triggered by the ESXi Hardware Check and the other by the ping service.
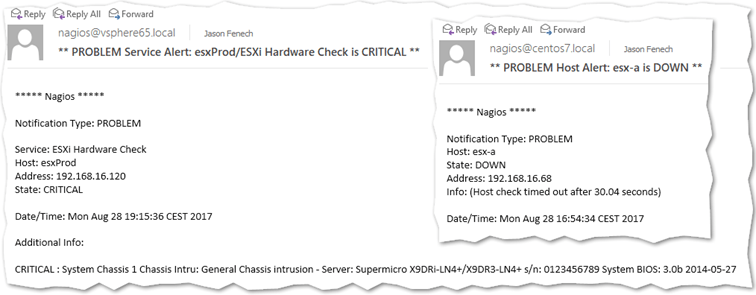
Email notifications in Outlook sent out by Nagios
Conclusion
Monitoring ESXi using Nagios isn’t that difficult although getting acquainted with the product will take some time. Admittedly, I only scratched the surface when it comes to Nagios’ functionality. Truth be said, I’m learning to use the product myself. This 2-part series, however, should get you going in no time at all. For further details, visit the official documentation page and the Nagios knowledge base.
Have a look at vRealize Log Insight: A first look and how to deploy it if you’re specifically looking for a VMware logging and monitoring solution.


Not a DOJO Member yet?
Join thousands of other IT pros and receive a weekly roundup email with the latest content & updates!
More in this category


About the Author
Jason Fenech


16 thoughts on "How to monitor ESXi with Nagios Core – Part 2"
Hi,
Can you please help me with this issue?.
[root@ardc01nagios libexec]# ./check_esxi_hardware.py -H IP –user=root –pass=xxxxxxxx
UNKNOWN: (0, ‘Socket error: [SSL: CERTIFICATE_VERIFY_FAILED] certificate verify failed (_ssl.c:661)’)
[root@ardc01nagios libexec]#
Hi Federico,
The problem seems to be a python issue so I suggest you try updating your Linux host to the latest patches, etc. Other than that, I haven’t come across the issue.
https://github.com/Napsty/check_esxi_hardware/issues/7
regards
Jason
Great post, installed and working successfully.
The only thing is that, after deployed in the Host groups the “ping” is OK but the hardware status is “CRITICALl” on the details it shows:
(No output on stdout) stderr: execvp(/usr/local/nagios/libexec/check_esxi_hardware, …) failed. errno is 2: No such file or directory
Do you know what is the reason of this?
Thanks a lot!
Thanks for the feedback. Probably you’re missing some plug-ins. Have a look at this; https://osric.com/chris/accidental-developer/2016/12/missing-nagios-plugins-in-centos-7/
For centos 7 is the same procedure.. I have the same error:
(No output on stdout) stderr: execvp(/usr/local/nagios/libexec/check_esxi_hardware, …) failed. errno is 2: No such file or directory
When editing commands.cfg, the text says:
command_line $USER1$/check_esxi_hardware -H $HOSTADDRESS$ -U $ARG1$ -P $ARG2$ -V $ARG3$
but it is missing the .py after the script name and the -V $ARG$ doesn’t seem to refer to anything. I changed it to the below and it worked.
command_line $USER1$/check_esxi_hardware.py -H $HOSTADDRESS$ -U $ARG1$ -P $ARG2$
Thank you for the article. It was helpful. Is there a way to monitor the CPU RAM VMS and other details on Esxi using nagios. Haven’t been able to find the right plugin.
Hi Rahul. This would actually defeat the purpose of using Nagios in a way.
The VM resources in VMware give you an idea of how much it uses to schedule workloads, however it is not as accurate as what’s really going on the guest (especially the memory!).
Meaning you should monitor the VM resources from within the guest (agent), then you monitor the host’s resources (esxi).