Save to My DOJO
Table of contents
- What is Nagios?
- What is NSClient++?
- Phase 1: Select a Location for Nagios
- Phase 2: Download Nagios
- Phase 4: Installing Nagios
- Phase 5: Configuring Nagios to Send E-mail
- Phase 6: Downloading and Installing NSClient++
- Final Installation Phase: Verify Your Environment
- Basic Nagios Installation Troubleshooting
- Controlling Nagios
- An Introduction to Nagios Configuration Files
- Nagios Objects and Their Uses
- Useful Nagios Objects Documentation
- Dealing with Problems Reported by Nagios
- Nagios Availability Reports
- Using Nagios to Monitor Hyper-V – The real fun stuff starts here!
I constantly insist that everyone should be monitoring their Hyper-V environment at all times. I’m sure that more than a few of you have thought, “Easier said than done.” The monitoring tools for Hyper-V that are available are either priced beyond the reach of the typical small business or are just too time-consuming to deploy and maintain.
I can’t do anything about pricing for the commercial offerings. What I can do is bring the difficulty level down substantially for one of the most popular free monitoring tools: Nagios Core. The Nagios product line is already used by millions of administrators to monitor Windows boxes, Linux systems, network switches, printers, and just about anything else that can be reached over a network connection. In this post, I’ll show you how to set up and become acquainted with Nagios Core, which is the completely free edition of Nagios. I’m also going to show you the basics of NSClient++, which is a free Windows-based application that operates as a Nagios client.
For our subscribers (FREE updates whenever we publish new articles, eBooks, tools and webinar announcements), we have particularly special treats in store. I have already developed a number of scripts that interact with Nagios for the specific purpose of monitoring Hyper-V. With little more than copy/paste effort on your part, you will be able to use Nagios Core to:
- Watch the space usage of dynamically-expanding virtual hard disks
- Keep an eye on the age of checkpoints (snapshots) so that you can handle them before they get too large
- Get ample warning when virtual machine storage is running low on space
- and much more to come!
Here’s a sample of what’s in the subscriber’s area:
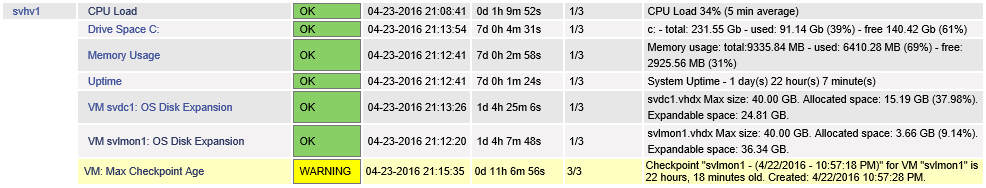
Nagios Sample Data
The best part is, I’m going to do all of the really hard work for you. Well, maybe the best part is that, assuming that you have somewhere to run it, you’re going to get all of this for free. Get access to the subscriber’s area and the free scripts at the bottom of this post.
Updated March 26, 2017 to cover Nagios 4.3.1 and Nagios Plugins 2.1.4
What is Nagios?
Nagios is an open source software tool that can be used to monitor network-connected systems and devices. The software’s core processes data from sensors and separates the results into categories. By name, these categories are OK, Warning, and Critical. The core software can respond to these sensor states in a highly configurable fashion. For our purposes, we will allow Nagios to follow its default of sending a repeating e-mail when a sensor is in a persistent Warning or Critical state and a single “Recovery” e-mail when it has returned to the OK state.
Sensor data can be collected by “active” checks and/or “passive” checks. Active checks occur when Nagios periodically triggers plug-ins to gather information. Passive checks are when remote processes “call home” to the Nagios system and voluntarily report status to a plug-in. The plug-in then delivers the sensor data to Nagios for processing.
The flexibility of the Nagios system is provided by these plug-ins. There are several plug-ins freely available alongside the Core edition, some of which we will put to use. Others are separately available via the community. Some are only included with the paid editions of Nagios. I will not be covering those. A plug-in is nothing more than a small Linux executable that collects information in accordance with its programming and returns data in a format that Nagios can parse.
Nagios has multiple configurable options. One that we will be using is its web interface — a tiny snippet is shown in the screenshot above. This interface is not required, but grants you the ability to visually scan your environment from an overview level down to the individual sensor level. It also gives you other abilities, such as “Acknowledging” a Warning or Critical state (which effectively silences notifications without permanently disabling the alarm) and re-scheduling pending checks to make the next one occur very quickly while you test or much later while you repair.
Nagios has a reputation for being difficult to use, which I don’t think is appropriate. It doesn’t have the same number of sensors configured out-of-the-box as other solutions, which means some more work on the administrator’s part. I believe that the real reason people don’t like it is because you configure it with text files instead of in some flowery GUI (unless you pay for a higher-grade subscription). The list of default text files include templates that not only show you exactly what you need to do, but also give you the ability to set things up via copy/paste and only a bit of typing. Personally, I found the learning curve to be very steep but also very short. Overall, I find it far easier to work with Nagios Core than with the monitoring component of Microsoft’s full-blown Systems Center Operations Manager.
What is NSClient++?
NSClient++ is a small service application that resides on Windows systems and interacts with a remote Nagios system. We will be using it as a target for the “check_nt” and “check_nrpe” Nagios plug-ins. Upon checking active check queries from these two plug-ins, it performs the requested checks and returns the data to those plug-ins.
Phase 1: Select a Location for Nagios
The first step to installing Nagios is choosing what system will host the monitoring application. If you know how, you can run Nagios anywhere that you like. I think that there is even a fork that works with Windows. In this post, I’m going to use a Hyper-V virtual machine running Ubuntu Linux Server 16.04 (Xenial Xerus). That works well for me because I have multiple Hyper-V hosts and I can create multiple monitoring systems. If you’ve only got one Hyper-V host, you might want to install Linux on some other physical unit. If you don’t, your only Nagios installation will be unable to notify you when your only Hyper-V environment is offline. Linux with Nagios is an extremely low-powered installation, so you can use just about any computer that you can get your hands on.
For perspective, I have configured my Nagios guest with 2 vCPU, 512MB startup RAM, 256MB minimum RAM, and 1GB maximum RAM. This is what it looks like during operation:
Nagios Resource Usage
If you’re not a Linux person and you need help getting started, follow my post on installing Ubuntu Server. I will be referring to that article from this one in a number of places. If you’re installing on a hardware system and not as a Hyper-V guest, the instructions will still work just fine — just skip the parts about installing the virtualization components.
Because Nagios needs so few resources, I elected to install it on the same Linux server that runs MRTG. These two tools work wonderfully together and can even share a bit of data. All that I did was rename the system from ‘svlmrtg’ to ‘svlmon1’: ‘sv’ for “Server”, ‘l’ for “Linux”, ‘mon’ for “Monitoring”, and ‘1’ because I will have an svlmon2 system that monitors svlmon1. Ubuntu Server can be renamed by using the directions that I gave at the end of the Ubuntu article.
I did not configure the virtual machine that runs Nagios as highly available. It runs from local storage on my first Hyper-V host. My second Hyper-V host will operate ‘svlmon2’. I could mirror the configurations, but in this case I’ll just have the second system monitor the first one. This gives me the greatest monitoring breadth without also sending me two notifications for every problem.
The only special thing that you need to do is ensure that your Nagios system’s IP address does not change. I use DHCP reservations as shown in the Ubuntu Server installation post. If you want to set it statically, try this article. Nagios itself does not care what its IP address is, but we’re going to be use NSClient++ with source IP restrictions. At this time I do not plan to use passive checks, but if that’s in the future then it will be more easily done with a static IP.
Phase 2: Download Nagios
Once you have a location selected, the next phase is to download Nagios. It is possible to use WGET to download it directly to Ubuntu Server. I have a strict rule against undertaking any browsing or downloading operations on a server, and I’m not about to break that habit. If you look online, you can figure out how to do it from someone else. What I do is download it to my management computer and then use WinSCP to transfer it (this tool is demonstrated in my Ubuntu Server installation post). We’re going to be using WinSCP anyway, so you might as well get used to it early.
Start on Nagios.org. I’ll give step-by-step instructions that worked on the day that I wrote these words, but seeing as how this is the Internet that we’re talking about, it might be different by the time you read these words. Your goal is to download Nagios Core and the Nagios Plugins.
- From the Nagios home page, hover over Downloads at the top right of the menu. Click Nagios Core.
- You’ll be taken to the editions page. Under the Core column, click Download.
- If you want to fill in your information, go ahead. Otherwise, there’s a Skip to download link.
- You should now be looking at a table with the latest release and the release immediately prior. At the far right of the table are the download links. For reference, the version that I downloaded said nagios-4.3.1.tar.gz. Click the link to begin the download. Don’t close this window.
- After, or while, the main package is downloading, you can download the plugins. You can hover over Downloads and click Nagios Plugins, or you can scroll down on the main package download screen to Step 2 where you’ll find a link that takes you to the same page.
- You should now be looking at a similar table that has a single entry with the latest version of Nagios tools. The link is at the far right of this table; the one that I acquired was nagios-plugins-2.1.4.tar.gz. Download the current version.
- Connect to your target system in WinSCP (or whatever other tool that you like) and transfer the files to your user’s home folder. I tend to create a Downloads folder (keep in mind that Linux is case-sensitive), but it doesn’t really matter if you create a folder or what you call it as long as you can navigate the system well enough to find the files.
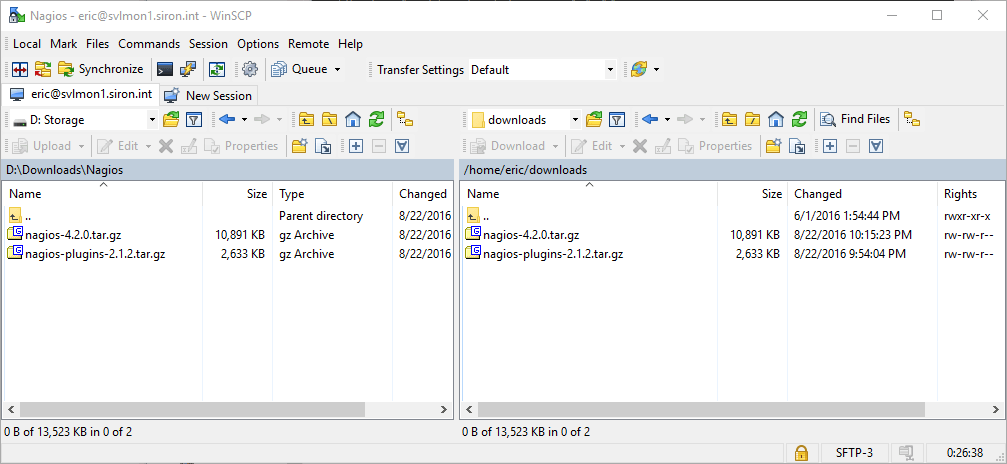
File Transfer
Phase 3: Preparing for Nagios
Before you can install Nagios, you’ll need to satisfy some prerequisites. From this point forward, we are going to be working almost exclusively on the Linux system. If you like, you can work directly at the console. I will be using PuTTY. This tool was also explained in my Ubuntu Server installation post. Most of what I’m going to show you can be copy/pasted so don’t let it look worse than it is.
Important: I will be showing when you should be using sudo. It will be necessary for almost every line. I will try to point out the few times where sudo is unwarranted. This note is mostly important for those of you that want to use sudo -s.
First, we’ll install all of the supporting software.
sudo apt-get install apache2 php libapache2-mod-php php-gd php-cgi build-essential libgd-dev libssl-dev unzip
Then, we’ll create a user for operating Nagios.
sudo useradd -m -s /bin/bash nagios
sudo passwd nagios
Upon entering the passwd command, you’ll be asked to provide a password. I don’t want to tell you what to do, but you should probably keep note of it.
Next, we’ll create a security group responsible for managing Nagios and populate it with users.
sudo groupadd nagcmd
sudo usermod -a -G nagcmd nagios
sudo usermod -a -G nagcmd www-data
sudo usermod -a -G nagcmd eric
sudo usermod -a -G nagios eric
If you’re just blindly copy/pasting, you should probably be aware that you just added my user account to your nagcmd and nagios groups. Since my account isn’t on your server, it probably won’t work, but if it does, well, be more careful next time.
Create an Apache account that can access Nagios. This is the username and password that you’ll use when logging in to the Nagios site. I’ve used “nagiosadmin” here because that’s what’s in the Nagios documentation, but you are certainly welcome to use anything that you like.
sudo htpasswd -c /usr/local/nagios/etc/htpasswd.users nagiosadmin
You’ll be asked to enter a password for the newly created account.
Warning: If you want to add other web accounts, do not use the -c argument. That rebuilds the htpasswd.users file as empty. Otherwise, the command is the same as shown above for each additional account.
To wrap up the prerequisites, enable Apache to use CGI.
sudo a2enmod cgi
If you want, you can restart Apache now (service apache2 restart), but it’s OK to save that for later.
That’s all for the prep work. Now let’s install Nagios.
Phase 4: Installing Nagios
With the files downloaded and unpacked on the Linux system and the prerequisites taken care of, we now jump into the “hard” part.
Unpacking the Source Code
We’ll start off by unpacking the zip files that contain Nagios and the plugins. Be aware that whatever folder that you’re in when you run the script is where the files will be unpacked. I place them right in that Downloads folder underneath my home folder, but do as you will. Just change the cd command that I show as necessary.
cd ~/Downloads
tar -xzf nagios-4.3.1.tar.gz
tar -xzf nagios-plugins-2.1.4.tar.gz
Notice that I didn’t use sudo on any of the above lines. This is because these files live in your own personal folder. If you use sudo to unpack them, then you’ll always have to use sudo to manipulate them.
The commands will create a nagios-4.3.1 folder and a nagios-plugins-2.1.4 folder (I haven’t been keeping the screenshots up-to-date so the version numbers won’t match):
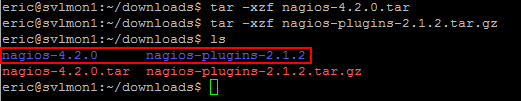
Unpacked Nagios Folders
Compiling and Installing Nagios
Windows administrators aren’t accustomed to compiling tools, but it’s fairly normative for Linux admins. Luckily, the good folks that make Nagios have done a good job of getting most of the things to a place where you just need to copy/paste a few commands. I highly recommend entering these individually so that you can verify the final output of each step. Do not copy/paste the entire block at once.
Note: If upgrading, STOP after sudo make install or you’ll need to redo the config files!
cd ~/Downloads/nagios-4.3.1/
sudo ./configure --with-command-group=nagcmd --with-httpd-conf=/etc/apache2/sites-enabled
sudo make all
sudo make install
sudo make install-init
sudo make install-config
sudo make install-commandmode
sudo make install-webconf
Nagios is now compiled and installed. We’re not quite done with it yet.
Reload Apache so that it can read the new Nagios configuration modules.
sudo service apache2 restart
Note: If upgrading and you stopped after sudo make install, just run sudo systemctl daemon-reload to load the new Nagios executable, sudo service nagios checkconfig to verify your configuration, and sudo service nagios restart. You’re done with the Nagios upgrade! Skip down to the plugins part to upgrade those, and you’ll be finished.
For new installs, there won’t be much to see yet. If you’d like some proof that I haven’t just been wasting your time, you can now access your page at http://yourservername/nagios.
Unfortunately, Nagios won’t work at this point, at least not on Ubuntu, and presumably other Debian-based distributions. Ubuntu’s folder structure has changed somewhat since the Nagios team last updated their detection scripts. What you’re going to need to do is dig into one of its configuration files and make two tiny changes.
Open the Nagios service configuration file with the following:
sudo nano /etc/init.d/nagios
Scroll down (use the arrow keys) until you see the following Source function library section:
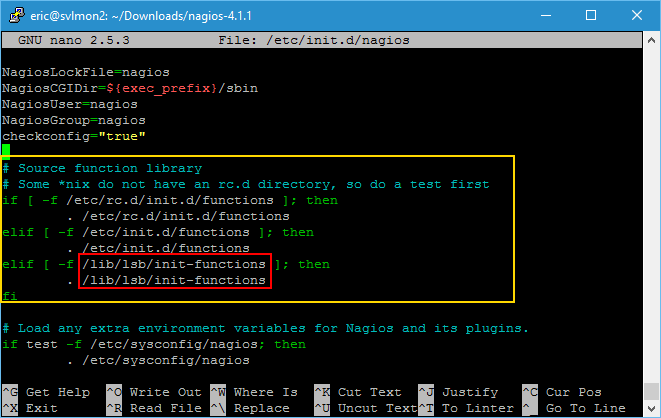
Broken Init Functions
The two lines that I’ve highlighted in red are all that you need to concern yourself with. All that you’re going to do is stick a .d on the end of the word functions in both lines:
# Source function library
# Some *nix do not have an rc.d directory, so do a test first
if [ -f /etc/rc.d/init.d/functions ]; then
. /etc/rc.d/init.d/functions
elif [ -f /etc/init.d/functions ]; then
. /etc/init.d/functions
elif [ -f /lib/lsb/init-functions.d ]; then
. /lib/lsb/init-functions.d
fi
Press [CTRL+X] to exit, then [Y] when prompted to save, and [Enter] to confirm that you want to save the file right where you found it.
Note: If you wanted, you could just replace the entire if/fi block with . /lib/lsb/init-functions.d. Doing so would speed up service startup by an imperceptible amount of time. I’m a fan of tinkering with original files only by the minimum amount.
The final bit is to set up Nagios as a service. The most important part is to configure Nagios so that the system recognizes it as a service and starts it up at each boot. We’re going to place it near the end of the load order.
sudo ln -s /etc/init.d/nagios /etc/rcS.d/S99nagios
That looks cryptic, but it’s really not so bad. You’ve created a symbolic link (basically, a shortcut) to the Nagios service utility (/etc/init.d/nagios) in one of the folders where Ubuntu will look for services when it starts. You can browse the contents of /etc/init.d to see your new symbolic link in context of the others so that you get an idea for what happened. If you reboot now, Nagios will respond to all of the normal service commands. Until then, service nagios restart/stop/start/status will not work properly. If you want to reboot, go ahead. If you just want to start the service and get going immediately:
sudo /etc/init.d/nagios start
You can use the above with arguments “start”, “restart”, and “stop” and it will work.
Optional: Configure the Nagios Web Site as the Default Site and/or by Name
As configured, you’ll access Nagios’ web interface via http://yourserver/nagios. If you want, you can have it respond to http://nagios and/or http://yourserver.
Configure Nagios to Open at http://nagios
To have Nagios open to http://nagios and http://nagios.yourinternaldomain.tld:
sudo nano /etc/apache2/sites-enabled/nagios.conf
Go all the way to the bottom of the file. Drop in the following text:
<VirtualHost *:80>
        ServerName      nagios.siron.int
        ServerAlias     nagios.siron.int
        ServerName      nagios
        ServerAlias     nagios
        DocumentRoot    /usr/local/nagios/share
        ScriptAlias     /nagios/cgi-bin "/usr/local/nagios/sbin"
        ScriptAlias     /cgi-bin        "/usr/local/nagios/sbin"
        Alias           /nagios         /usr/local/nagios/share
        <Directory "/usr/local/nagios/sbin">
                Options ExecCGI
                AllowOverride None
                Order allow,deny
                Allow from all
                AuthName "Nagios Access"
                AuthType Basic
                AuthUserFile /usr/local/nagios/etc/htpasswd.users
                Require valid-user
        </Directory>
        <Directory "/usr/local/nagios/share">
                Options None
                AllowOverride None
                Order allow,deny
                Allow from all
                AuthName "Nagios Access"
                AuthType Basic
                AuthUserFile /usr/local/nagios/etc/htpasswd.users
                Require valid-user
        </Directory>
</VirtualHost>
Change my domain name on the marked line for yours. While you’re in here, take some time to look at the content above what you pasted. That’s how the web site is configured. Compare it with the entries that I had you type above, and you’ll see how to control the site if you want to make other changes.
Before this will work, you’ll need to access your DNS server and create a CNAME that directs ‘nagios.yourdomain.tld’ to ‘yourserver.yourdomain.tld’. You can create an A record if you’d prefer, although the CNAME is more resilient.
Restart Apache:
sudo service apache2 restart
Configure Nagios to Open on the Server’s Name
If you want your Nagios installation to respond when someone enters http://yourserver instead of showing the default Apache page:
sudo nano /etc/apache2/sites-enabled/000-default.conf
Comment out the existing DocumentRoot line and replace it with:
DocumentRoot /usr/local/nagios/share
Restart Apache:
sudo service apache2 restart
Warning: Making this change will cause the localhost service check for HTTP to show a warning condition with a 401 error because it can’t log in. This check does not send notifications by default so you won’t be pestered by it, but you will have a yellow warning condition if you don’t disable the check. You can create a modified check_http command (you’ll see the check_ commands in a moment) to login or to just accept 401 as an indication that the site is working. When you discover the plugin folder (I’ll show it to you in the next section), use ./check_http –help for configuration instructions.
Compiling and Installing the Basic Nagios Plugins
This procedure is sort of a miniature version of what you did with Nagios itself.
cd ~/Downloads/nagios-plugins-2.1.4/
sudo ./configure --with-nagios-user=nagios --with-nagios-group=nagios
sudo make
sudo make install
If you’re upgrading and stopped the Nagios installation before overwriting any configuration files, you are now completely finished! Nagios calls its plugins as needed so if you’ve already reset the service, you don’t need to do it again.
For new installs, you have a fully functional, if basic, Nagios installation. It can’t do a lot for us just yet — it can ping things and check Linux servers, but it can’t do much with Windows. To get a glimpse of what it can do, navigate to /usr/local/nagios/libexec:
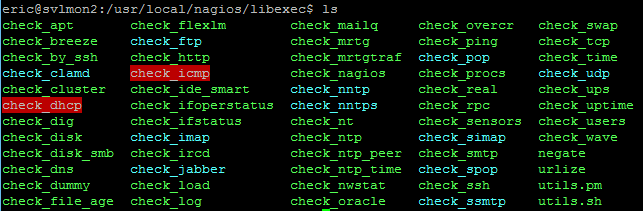
Default Nagios Plugins
If you see anything interesting, I’ll leave it to you to do some exploration. To get started, enter the command with the help parameter, ex: ./check_load –help. You’ll also find lots of helpful blog posts out there detailing what other people have done with many of these plugins. I’m going to keep a fairly tight focus on Windows (and therefore Hyper-V) systems.
Quick Note on the SNMP Plugin
Some plugins are only included in the paid editions of Nagios, but you can get still community-supported versions. The SNMP plugin is one of those. I have SNMP running on most of my systems for MRTG monitoring but I have not yet felt compelled to enable Nagios to check it. If you would like to monitor SNMP services, you’ll need net-snmp. and a community-supported plugin, such as this one.
The NRPE Plugin
For the things that I want to do, we need to run PowerShell scripts on the monitored systems. In order to do that, we’re going to need a “partner” application running inside those target systems that Nagios can communicate with. That application will be NSClient++. However, Nagios and NSClient++ alone do not speak enough of the same language to operate scripts. We’ll need to use a Nagios plugin called NRPE (Nagios Remote Plugin Execution).
An Aside on NRPE Security
You might read in some places that NRPE plugin is a security risk. That is correct. It allows one computer to tell another computer to run a script and return the results. Furthermore, we’re going to be sending arguments (essentially, parameters) to those scripts. Doing so opens the door to injection attacks. One method that has been used to combat the issue is NRPE traffic encryption. I am not going to be exploring how to encrypt NRPE communications, at least not in this post.
I have several reasons for this:
- The simplest reason is that it’s difficult to do and I’m not certain of how much value is in the effort.
- Encryption is often mistaken for data security when it is, in fact, more about data privacy. For example, if you transmit your password in encrypted format and the packet is intercepted, the attacker still has your password. The fact that it’s encrypted might be enough to put the attacker off, but any encryption can be broken with sufficient time and effort. Therefore, your password is only private in the sense that no casual observer will be able to see it. To keep it secure, you should not transmit it at all. We don’t really have that option. Because we are not encrypting, what an attacker could see is the command string and the result string. You’ll have full knowledge of what those are, so you can decide how serious that is to you. Our best approach is to ensure that the Nagios<->host communications chain only occurs on secured networks, even if we later enable SSL.
- The author of NSClient++ had the good sense to ensure that you can’t operate just any old script or a free-form script via NRPE. Scripts must be specifically enabled and can be tightly controlled. If the script itself is sufficiently well-designed, a script injection attack should be prohibitively difficult.
- The author of NSClient++ also coded in the ability to restrict NRPE activities to specific source IP addresses. IP spoofing is possible, of course.
- Windows, Linux, and/or hardware firewalls can help enforce the source and destination IP communications. Spoofing is still a risk, of course.
What I didn’t address in the above points is that NSClient++ effectively authenticates the Nagios computer by only accepting traffic that was encrypted with its private key. So, yes, NRPE is a security risk and it is a higher risk without SSL. I won’t try to convince you otherwise. I believe that, for internal systems, the risk is very manageable. If you’re going to be connecting to remote client sites, I would put the entire Nagios communications chain inside an encrypted VPN tunnel anyway because even if you encrypt NRPE, the other traffic is clear-text. The only people that I think should worry much about this are those that will be connecting Nagios to Hyper-V hosts using unsecured networks. Personally, I’m uncertain how a case could be made to do that even with SSL configured.
I’m not saying that I’ll never look into encrypting NRPE. Just not now, not in this article.
Downloading and Unpacking the NRPE Plugin Source Code
As with the base Nagios packages, I download NRPE on my management Windows machine and transfer it to the targets with WinSCP. The download URL is: https://sourceforge.net/projects/nagios/files/nrpe-2.x/. Don’t use the “Latest Version” links because you’ll just get a full copy of Nagios again, and it won’t even include NRPE. Specifically locate the latest listed version (the one that I have is 2.15). Download it, and transfer the package to your home folder (or, optionally, your Downloads folder if you created one).
Unpack it:
cd ~/Downloads
tar xzf nrpe-2.15.tar.gz
Installing the NRPE Plugin
Even though I’m not going to work on SSL with NRPE at this time, I recommend compiling it with SSL support. This will reduce the amount of effort that you’d need if you want to try to enable it later.
cd ~/Downloads/nrpe-2.15
sudo ./configure --with-ssl=/usr/bin/openssl --with-ssl-lib=/usr/lib/x86_64-linux-gnu
sudo make all
sudo make install-plugin
If you’d like, you can also install NRPE as a daemon (much like a Windows service). This will allow it to accept inbound check reports — what Nagios calls passive checks. I am not using Nagios for this purpose so I did not enable the daemon. If you’re interested, step 3.c.iv in the NRPE documentation explains this configuration.
You can verify that the plugin was created and installed by examining the contents of /usr/local/nagios/libexec.
Phase 5: Configuring Nagios to Send E-mail
I know that Ubuntu Server 16.04 can install a mail server during Linux installation. My instructions that I follow are older than that and I’m still using them. Sorry for any inconvenience.
Configuring Linux to Send E-mail Using Your Domain
This sub-section explains how to configure your Nagios system to operate as an SMTP server. Nagios will use this SMTP server to directly connect to target SMTP servers to transmit mail. In other words, it is a real SMTP server. Follow these directions if and only if, your organization has its own Internet-visible domain that you can send e-mail from and if you can directly send outbound e-mail from where your Linux server is (ex, you have a static IP with a valid publicly-visible reverse DNS entry), or if you can transmit outbound SMTP mail through a smart host, or if you will only use SMTP to connect to another SMTP system internally that can be configured to recognize your Nagios system as a valid source. If you need to use some sort of external service (as in, by logging into an individual POP/SMTP account on your ISP’s mail server), skip to the next subsection.
This is simply handled by installing mailutils:
sudo apt-get install mailutils
You’ll get the following screen:
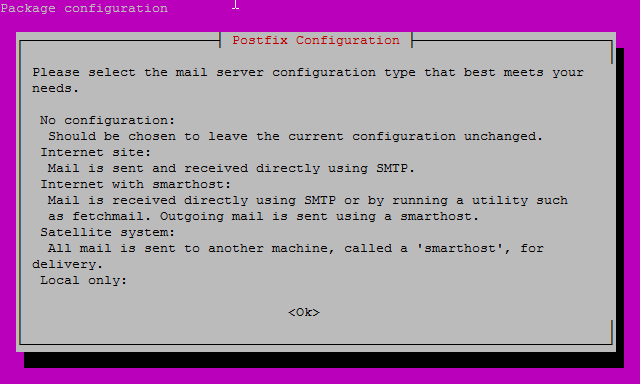
mailutil Install Screen
On the next screen, you’re going to pick one of these. What you see above is the legend for that next screen. Unfortunately, I cannot tell you how to configure your e-mail so pick the option that is best for you. Screens after that will depend on what you picked here. Best of luck! When you’re done, I would do an Internet search for “postfix” so you can get configuration tips and advice. I do know that you’ll want to run the following wizard to finish configuration:
sudo dpkg-reconfigure postfix
I no longer have access to a system where I can properly test this, but I do know that the above was enough for me to get it all working when I did have such a system. You can use the following template from any host with a telnet client to test your new mail server:
telnet 127.0.0.1 smtp
helo nagiostestmail.mydomain.com
mail from:[email protected]
rcpt to:[email protected]
data
subject:Checking Nagios e-mail
Hi, this is a test message from the Nagios system.
.
quit
If it doesn’t go through, errors are recorded in /var/log/mail.log.
Nagios will automatically use the /usr/bin/mail executable, so you don’t need to do anything else for e-mail. You’re all done!
Configure Nagios to Use an Individual Account with an ISP
I can’t use an SMTP server from my home for a lot of reasons, so this is what I have to do in my test lab, and I’m sure some of you smaller shops will have the same issue. Do not follow these steps if you successfully followed the preceding sub-section.
sudo apt-get install sendemail
Edit the Nagios user-defined entries file (Note: if you are upgrading and accidentally executed install-config, your previously edited file has been renamed to resource.cfg~):
sudo nano /usr/local/nagios/etc/resource.cfg
Add the following, substituting in your ISP information:
[email protected]
$USER7$=smtp.server.tld
$USER9$=authsmtpusername
$USER10$=authsmtpassword
What you use for $USER5$ is the account that Nagios will send e-mails from. I have an account with Microsoft and can use these directions. I assume that it will work for all @outlook.com, @live.com, @msn.com, and @hotmail.com addresses.
Next, you need to edit the Nagios commands.cfg file to use sendemail instead of mail. You can do this with nano. If you find nano’s side-scrolling behavior to be distasteful, you can use WinSCP instead. Depending on how you configured your users and groups in the beginning of this article, you might need to login through WinSCP as the nagios user. Note: if you are upgrading and accidentally executed install-config, your previously edited file has been renamed to commands.cfg~.
sudo nano /usr/local/nagios/etc/objects/commands.cfg
In the ‘notify-host-by-email‘ section, comment out the existing command_line and replace it with:
command_line /usr/bin/printf "%b" "***** Nagios *****nnNotification Type: $NOTIFICATIONTYPE$nHost: $HOSTNAME$nState: $HOSTSTATE$nAddress: $HOSTADDRESS$nInfo: $HOSTOUTPUT$nnDate/Time: $LONGDATETIME$n" | /usr/bin/sendEmail -s $USER7$ -xu $USER9$ -xp $USER10$ -t $CONTACTEMAIL$ -f $USER5$ -l /var/log/sendEmail.log -u "** $NOTIFICATIONTYPE$ Host Alert: $HOSTNAME$ is $HOSTSTATE$ **" -m "***** Nagios *****nnNotification Type: $NOTIFICATIONTYPE$nHost: $HOSTNAME$nState: $HOSTSTATE$nAddress: $HOSTADDRESS$nInfo: $HOSTOUTPUT$nnDate/Time: $LONGDATETIME$n"
In the ‘notify-service-by-email‘ section, comment out the existing command_line and replace it with:
command_line /usr/bin/printf "%b" "***** Nagios *****nnNotification Type: $NOTIFICATIONTYPE$nnService: $SERVICEDESC$nHost: $HOSTALIAS$nAddress: $HOSTADDRESS$nState: $SERVICESTATE$nnDate/Time: $LONGDATETIME$nnAdditional Info:nn$SERVICEOUTPUT$" | /usr/bin/sendEmail -s $USER7$ -xu $USER9$ -xp $USER10$ -t $CONTACTEMAIL$ -f $USER5$ -l /var/log/sendEmail.log -u "** $NOTIFICATIONTYPE$ Service Alert: $HOSTALIAS$/$SERVICEDESC$ is $SERVICESTATE$ **" -m "***** Nagios *****nnNotification Type: $NOTIFICATIONTYPE$nnService: $SERVICEDESC$nHost: $HOSTALIAS$nAddress: $HOSTADDRESS$nState: $SERVICESTATE$nnDate/Time: $LONGDATETIME$nnAdditional Info:nn$SERVICEOUTPUT$"
If your e-mail provider requires you to use TLS (hopefully, it does), append the following to both lines: -o tls=yes
You must restart Nagios for the change to take effect.
Phase 6: Downloading and Installing NSClient++
As explained above, NSClient++ is a Windows application that can communicate with Nagios. Download it from: http://nsclient.org/download/. The version that I’m using is 0.4.4.19. It doesn’t matter to me whether or not you use the 32-bit or the 64-bit version. I used the 64-bit version because, while I’m inclined to prefer 32-bit applications over 64-bit applications when they don’t use much memory, I assume that the 64-bit version will have the easiest time interacting with 64-bit PowerShell.
You have two deployment options: MSI or ZIP. For bulk operations, ZIP with your own custom script to install is best. I tried working with the MSI using Group Policy’s Assigned software, but it was an outright disaster. I attempted to use Orca to create a transform file, but it didn’t change enough to make the application usable. I then tried to call the MSI using MSIEXEC using switches according to the NSClient++ documentation, but that didn’t work either. This post will only show the interactive MSI installation, but with advance warning that even that has unpredictable outcomes. Continue reading after the basic install directions for guidance on cleaning up any inconsistencies.
The following will walk through an installation:
- On the first screen, choose Generic:
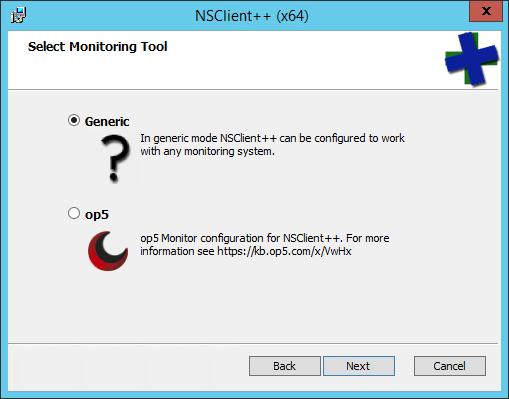
NSClient++ Monitoring Option
- On the Setup Type screen, choose Custom:
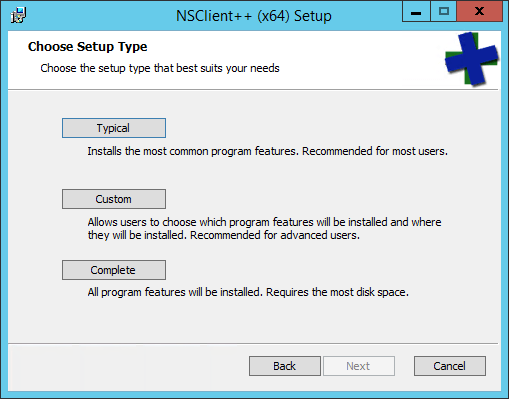
NSClient++ Setup Type
- On the Custom screen, I personally accept the defaults. I brought you to this screen to give you the opportunity to make modifications. For instance, you might want the sample configuration (underneath the Program branch). You might also want to prevent some of the plugins or scripts from being made available. Be aware that even if a script is available, it won’t be active unless it’s configured. For that reason, I just install that entire branch..
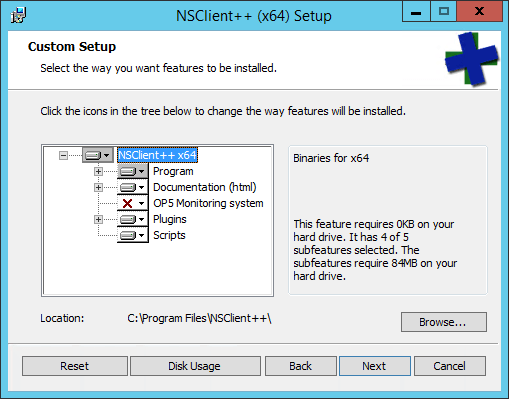
NSClient Custom Options
- The Configuration screen is probably the most important, but don’t worry too much about getting it right. Everything here can be easily changed later without reinstalling. The first thing to set is the Allowed hosts. If you’ll recall, I recommended that you give your Nagios installation a fixed IP. This is where you want to type that in. The Password is also important, although mostly so that it agrees with whatever you configure on the Nagios side. As you can see, I didn’t put a great deal of thought into my password because I’m not using network security in that fashion and I don’t know that it encrypts the password anyway. As for the Modules to load, the things that I’m going to show you require this configuration (if you can’t see the image, check: Enable common check plugins, Enable nsclient server (check_nt), Enable NRPE server (check_nrpe), and check the box for Insecure legacy mode (required by old check_nrpe)). As explained above, I’m not going through the secure transmission mode. I’m also not going to do anything with the NSCA client or the web server. These two features are very easily enabled later if you’re interested, so it doesn’t really matter if you pick them at this time.
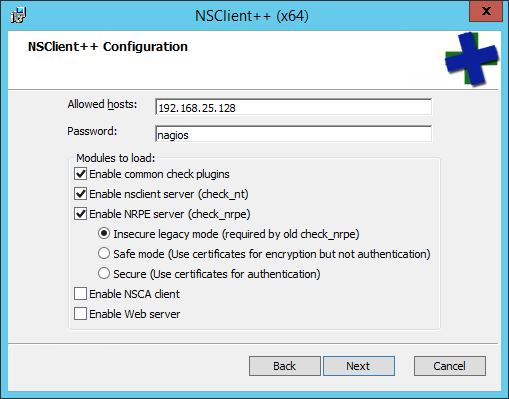
NSClient++ Configuration
- Now you’ll just have to click Install, watch the files be placed, then click Finish.
Warning: NSClient++ sometimes doesn’t work at all. I couldn’t install it, and if I tried to manually place the files and manually operate the program, it would simply do nothing — no errors, no logs. At first, I thought it was because I was installing on Windows Server in Core mode, but I rebuilt the systems and NSClient++ then worked just fine. I never determined what the problem was. I did notify the NSClient author via a GitHub ticket. If you’re also having problems, you can go enter a “me too” post.
As I mentioned, the installer isn’t terribly reliable. Options that you pick might or might not work. It’s easy enough to fix, but I recommend that you begin by determining if you have a problem. At a command prompt, type the following:
netstat -aon | findstr LISTENING
You should see entries for 5666 (check_nrpe) and 12489 (check_nt). If either is missing, you won’t be able to use those checks until the problem is fixed.
The fix is in ‘C:Program FilesNSClient++nsclient.ini’. Fortunately, we are headed there anyway to enable PowerShell. Open it up in an administrative Notepad process. You’re certainly welcome to use any editor that you like, but Notepad is present on all Windows installations, including Windows Server Core and Hyper-V Server.
You will see several lines with the text “; undocumented key” that mostly serve to throw off your interpretation of the layout of the file. This is a typical INI file. It has sections that are headed by text in brackets, ex: [/settings/default]. Underneath those section headers are entries relevant to that section.
With all of the fluff removed, an installation that matches what I showed in the installer’s config dialog looks like this:
[/settings/default]
password = nagios
allowed hosts = 192.168.25.128

[/settings/NRPE/server]
verify mode = none
insecure = true

[/modules]
CheckExternalScripts = 1
CheckHelpers = 1
CheckEventLog = 1
CheckNSCP = 1
CheckDisk = 1
CheckSystem = 1
NRPEServer = 1
NSClientServer = 1
If yours is different, fix it and save the file. At an elevated command prompt, run:
"c:Program FilesNSClient++nscp.exe" service --stop
"c:Program FilesNSClient++nscp.exe" service --start
It’s a normal Windows service with the name “nscp”, so you can also use ‘services.msc’, sc, or the PowerShell Stop-Service, Start-Service, and Restart-Service commands.
After the above, run netstat -aon | findstr LISTENING again to verify that the correct ports now have something listening.
If you have any problems with NSClient++ not honoring your installation options, this is where you go to fix them. It’s a lot easier than fighting with the installer. Once the INI file is correct, you’ll find that NSClient++ operates quite stably, so the problems are all in the MSI. Once you have a stable INI, you can use it for easy robocopy deployments to other hosts. Don’t do that yet, though, because we’re not quite finished.
Configuring NSClient++ to Run PowerShell Commands
Out of the box, NSClient++ won’t run any scripts except its own. For security purposes, that’s a good thing. For what we want to do, that’s a bad thing. Open up the ‘C:Program FilesNSClient++nsclient.ini’ file and make the following additions (by that, I mean, don’t delete anything!):
[/settings/external scripts]
allow arguments = true

[/settings/external scripts/wrappings]
ps1=cmd /c echo scripts%SCRIPT% %ARGS%; exit($lastexitcode) | powershell.exe -nologo -command -
NSClient++ has to start up an all-new session with each command, and you’re probably going to be running quite a few of them. In my INI file, I have also added the -noprofile parameter right after the -nologo parameter as it should speed up loading. This will work with all of the scripts that I’m going to share with you because not I am not calling any custom scripts out of any profile locations. I recommend that you also add -noprofile to your INI file, but be mindful of its effects if you start writing your own PowerShell checks.
Keep this INI file safe! From here on out, you can just copy/paste it on top of the INI files in other deployments or place it in a common location and robocopy it to other systems.
On every host that you’ll be running PowerShell scripts, open an elevated PowerShell script and run the following:
Set-ExecutionPolicy -Policy RemoteSigned
NSClient++ on Clustered Hosts
The scripts that I’m giving you will check clustered resources from whichever node currently holds the Cluster Name Object. As necessary, those scripts will communicate with constituent nodes. In order to ensure that NSClient++ does not encounter authorization barriers, you must do one of two things:
- Create a domain account for the NSClient++ service that has administrative access to all nodes in the cluster and run NSClient++ as that, or
- Add the computer account for each cluster node to the local Administrators group of all other nodes in the same cluster and leave NSClient++ running as LocalSystem
The domain account method is preferred for security reasons, but more difficult to enact and keep track of. I leave the choice to you. For more about Nagios and Clustered environments check out:
- Nagios for Hyper-V: Required Cluster Base Script
- Nagios for Hyper-V: Alert on Low Cluster Shared Volume Space
Final Installation Phase: Verify Your Environment
If you’ve made it this far, you have a perfectly operational skeleton environment. I would restart Apache and Nagios just to lock in any pending changes.
sudo service nagios restart
sudo service apache2 restart
If you’ve been following straight through, Nagios may not start and complain about a missing file. If that happens, first try this:
sudo systemctl daemon-reload
Then, try to start Nagios. If it doesn’t work, rebooting the Linux environment should set things to right.
Once the two services are (re)started, open up your web browser and navigate to the URL that you configured above. If you skipped all of that configuration, the default is http://servername/nagios. Navigate through the items in the menu bar in the left. The default configuration measures a few things on the local host, but that’s about it. As long as you can get something on every page that you can more or less understand, everything worked.
Basic Nagios Installation Troubleshooting
I’m neither a Linux nor a Nagios expert, but I ran into a few problems that were fairly easy to fix. Most of them were documented above, so just make sure that you didn’t try to skip ahead in the directions and you’ll have solved all the common problems before they ever occurred. If you skipped, go back and redo the parts that you missed and it will probably be fine.
Warning: You can recompile Nagios at any time, but if you run the install-config command during build, all of your configuration files will be replaced with samples. The files that you edited in previous versions will be kept with a ~ appended to the end of their names. You can perform copy/pastes of the information or file renames to recover your configuration work.
Problem: When loading the Nagios web page, you can see bits of what appears to be HTML code, such as angle brackets and references to CGI in Firefox and Microsoft browsers. The Google Chrome browser shows a raw text file instead of the web page. When clicking menu links, you are prompted to download a .cgi file.
Solution: The PHP CGI module is either not installed or it is inactive, so install and activate it. Enter the following:
sudo apt-get install php-cgi
You may also need to (re)enable it in Apache:
sudo a2enmod cgi
You will need to restart Apache (‘sudo service apache2 restart’). You will also need to clear your browser cache, sometimes multiple times. I had this problem after upgrading my Nagios host from Ubuntu 15.10 to 16.04 and the problem recurred several hours after I fixed it. Somehow, my browser (Firefox) managed to dredge up some version out of the cache. If the above doesn’t seem to be working, try another browser for verification. If it really doesn’t work, then I don’t know how to fix it, but would recommend going back through the prerequisites section to ensure that all of the modules are properly installed and that CGI mode for Apache is enabled. The root problem is definitely that Apache and PHP aren’t agreeing with each other. I can confirm, though, that this all works with the versions of Apache and PHP that are part of the Ubuntu Server 16.04 package files and the results are perfectly viewable in Microsoft Internet Explorer 11, Microsoft Edge, Mozilla Firefox, and Google Chrome.
Problem: The Nagios landing web page works fine, but all of the menu links take you to pages filled with gibberish and garbage characters.
Solution: The PHP GD module is either not installed or it is inactive. Enter the following:
sudo apt-get install php-gd
You will need to restart Apache (‘sudo service apache2 restart’).
Controlling Nagios
Nagios control from the Linux command line is very simple. You’ll soon memorize these commands. Activate them in a PuTTY session.
Check the Nagios Configuration
After making any changes to configuration files, verify that they are valid before attempting to apply them to the running configuration:
sudo service nagios checkconfig
If there are any problems, you’ll be told what they are and where to find them in the files. As long as you don’t stop Nagios, it will continue running with the configuration that it was started with. That gives you plenty of time to fix any errors.
Restart Nagios
Restart the Nagios service (only after verifying configuration!):
sudo service nagios restart
Stop and Start Nagios
If you need to take Nagios offline for a while and bring it up later (or if you forgot to checkconfig and have to recover from a broken setup), these are the commands:
sudo service nagios stop
sudo service nagios start
Verify that Nagios is Running
Usually, the ability to access the web site is a good indication of whether or not Nagios is operational. If you want to check from within the Linux environment:
sudo service nagios status
This will usually fill up the screen with information, so you’ll be given the ability to scroll up and down with the arrow keys to read all of the messages. Press [Q] when you’re finished.
An Introduction to Nagios Configuration Files
From here on out, I will be using WinSCP to manipulate the Nagios configuration files on the Linux host. Use PuTTY to issue the commands to check and restart the Nagios service after configuration file changes. You do not need to restart the Apache service.
Personally, I connect using the nagios account that we created in the beginning. WinSCP remembers the last folder that it was in per user, so it’s easier for navigation and so that you never run into any file permission problems. Just make a separate entry to the host for that account:
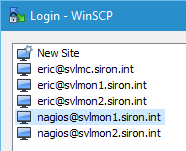
WinSCP Nagios Site
Work your way to /usr/local/nagios/etc. This is the root configuration folder. It mostly contains information that drives how it processes other files.
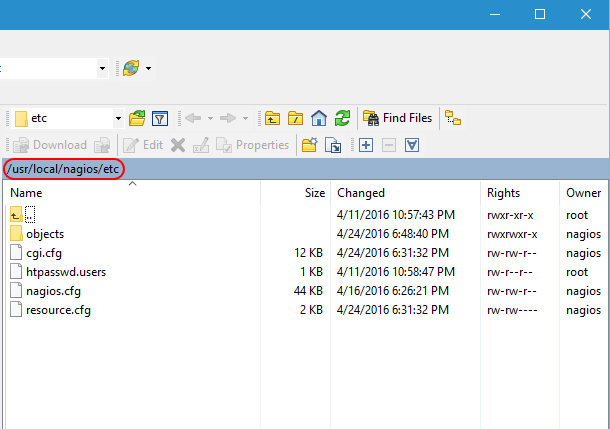
Nagios Root etc
This location contains four files. I’m not going to dive into them in great detail, but I encourage you to open them up and give their contents a look-over to familiarize yourself.
- cgi.cfg: As it says in the text, this is the primary configuration file. I have not changed anything in it.
- htpasswd.users: This is the file that Apache will check when loading objects. Use the instructions at the top of this article to modify it.
- nagios.cfg: This file contains a number of configuration elements for how Nagios interacts with the system. We are going to modify the OBJECT CONFIGURATION FILE(S) portion momentarily.
- resource.cfg: This file holds customizable macros that you create, like the ones for e-mail.
Now, open up /usr/local/nagios/etc/objects. This is where the real work is done.
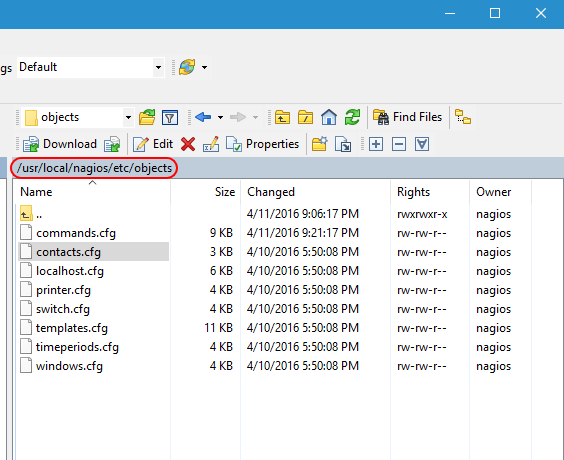
Nagios Configuration Folder in WinSCP
The file names are for your convenience only. Nagios reads them all the same way. So, don’t get agitated if you feel like a host template definition would be better in some file other than templates.cfg; Nagios doesn’t care as long as everything is formatted properly. This is what the files generally mean:
- commands.cfg: This contains the commands that constitute the actual checks. For instance, check_ping is defined here.
- contacts.cfg: When Nagios needs to tell somebody something, this is where those somebodies’ information is stored. It’s also where you connect users to time periods. For example, I have my administrative account in the business hours time period because I don’t really want to be woken up in the middle of the night because my test lab is unhappy.
- localhost.cfg: Contains checks for the Linux system that runs Nagios.
- printer.cfg: Define printer objects and checks here.
- switch.cfg: Physical switches and their check definitions are in this file.
- templates.cfg: Basic definitions that other definitions can inherit from are contained within.
- timeperiods.cfg: You probably don’t want to be notified in the middle of the night when a switch misses a single ping, but you might want to know about it during normal work hours. Define what “normal work hours” and “leave me alone” time is in this file.
- windows.cfg: Basic definitions for Windows hosts and checks.
Poke through these and get a feel for how Nagios is configured.
Nagios Objects and Their Uses
Nagios uses a few species of objects. Getting these right is important. Use the template file to guide you. The most pertinent objects are listed below:
- contact: A target for notifications — usually an individual.
- host: A host is any endpoint that can be checked. A computer, a switch, a printer, and a network-enabled refrigerator all qualify as a host.
- command: Nagios checks things by running commands. The command files live in its plugins folder. The command definitions explain to Nagios how to call those plugins.
- service: A “service” in Nagios is anything that Nagios can check with a command, and is a much more vague term than it is in Windows. In Nagios, services belong to hosts. So, if you want to know if a switch is alive by pinging it, the switch is a “host” and the ping is a “service” that calls a “command” called check_ping.
- host group: Multiple hosts that are logically lumped together constitute a host group. Use them to apply one service to lots of hosts at once.
- time period: This object is fairly well-explained by its name. They’re probably best understood by looking in the timeperiods.cfg file.
Nagios Templates
I’d say that the best place to start looking at Nagios objects is in the templates file. This is a copy/paste of the Contact template:
# Generic contact definition template - This is NOT a real contact, just a template!

define contact{
        name                            generic-contact    	; The name of this contact template
        service_notification_period     24x7			; service notifications can be sent anytime
        host_notification_period        24x7			; host notifications can be sent anytime
        service_notification_options    w,u,c,r,f,s		; send notifications for all service states, flapping events, and scheduled downtime events
        host_notification_options       d,u,r,f,s		; send notifications for all host states, flapping events, and scheduled downtime events
        service_notification_commands   notify-service-by-email	; send service notifications via email
        host_notification_commands      notify-host-by-email	; send host notifications via email
        register                        0       		; DONT REGISTER THIS DEFINITION - ITS NOT A REAL CONTACT, JUST A TEMPLATE!
        }
Start with the define line that indicates what type of object this block is describing. Most importantly, it signals to Nagios which properties should exist. Within this particular block, all properties for a contact are present with specific settings for each. If you use this template with a new object, then these will be its default settings. Next, notice the register line. By setting it to 0, you make it unavailable for Nagios to use directly, which is what makes this definition a template.. Now, look at an implementation of the above template:
# Just one contact defined by default - the Nagios admin (that's you)
# This contact definition inherits a lot of default values from the 'generic-contact'
# template which is defined elsewhere.

define contact{
        contact_name                    nagiosadmin		; Short name of user
	use				generic-contact		; Inherit default values from generic-contact template (defined above)
        alias                           Eric			; Full name of user
	service_notification_period	workhours

        email                           [email protected]	; <<***** CHANGE THIS TO YOUR EMAIL ADDRESS ******
        }
It is also defined as a contact. First, notice the use line. Its name matches that of the template. That means that you don’t need to provide every setting for this contact, only the ones that you want to differ from the template. It is not necessary for an object to use a template. You can fill out all details for an object. A live object cannot use another live object, though, but one template can use another.
I often make backups of my configuration files before tinkering with them. WinSCP makes this simple with the Duplicate command. I also tend to copy my live configuration files to a safe place. Even though this whole thing seems easy to understand, you will make mistakes. Some of your mistakes are going to seem very stupid in retrospect. Always, always, always run sudo service nagios checkconfig before applying any new changes!
Nagios Hosts
A host in Nagios is an endpoint. It’s an easy definition in my case because I am going to specifically talk about Hyper-V hosts. The following is a host template definition that I created for my environment:
###############################################################################
###############################################################################
#
# HYPER-V HOST DEFINITIONS
#
###############################################################################
###############################################################################

define host{
	use			hyper-v-server
	host_name		svhv1
	alias			Hyper-V Host 1
	address			192.168.25.10
}

define host{
	use			hyper-v-server
	host_name		svhv2
	alias			Hyper-V Host 2
	address			192.168.25.11
}
These hosts use a template that I created:
###############################################################################
###############################################################################
#
# HYPER-V HOST TEMPLATE DEFINITION
#
###############################################################################
###############################################################################

define host{
	use			windows-server
	name			hyper-v-server
	hostgroups		hyper-v-servers
	register		0
}
You’ll notice that this template uses the base windows-server template, but really makes no changes. I’m not overriding much in the windows-server template, so I could have all of my hosts use that one directly. However, creating a template to set up an inheritance hierarchy now is an inexpensive step that gives me flexibility later.
Nagios Groups
Most of the singular objects, like contacts and hosts, also have a corresponding group object. You might have noticed in my Hyper-V host template that it has a hostgroups property. Every host object that uses this template will be a member of the hyper-v-servers host group. Groups have very simple definitions:
###############################################################################
###############################################################################
#
# HYPER-V HOSTGROUP DEFINITION
#
###############################################################################
###############################################################################

define hostgroup{
	hostgroup_name		hyper-v-servers
	alias			Hyper-V Servers
}
I could also have used a members property within the host group definition or a hostgroups property within my Hyper-V host definitions to accomplish the same thing. This is less typing.
Host groups are very useful. First, they get their own organization on the Host Groups menu item in the Nagios web interface:
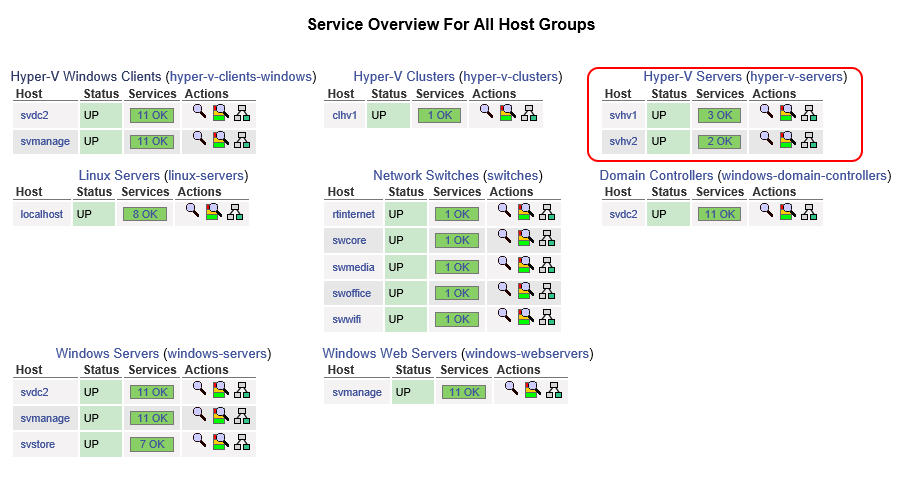
Nagios Host Groups Display
Second, you can define services at the host group level. That’s important, because otherwise, you’d have to define services for each and every host that you want to check, even if they’re all using the same check!
Nagios Services
Don’t let the term service confuse you with the same thing in a Windows environment. In Nagios, a service has a broader, although still perfectly correct definition. Anything that we can check is a service, whether that’s a ping response, Apache returning valid information on port 80, or even the output of a customized script like I have created for Hyper-V items.
The following is a service that I have created to monitor a Windows service — the Hyper-V Virtual Machine Manager service, to be exact:
# check that VMMS is running
define service{
	use			generic-service
	hostgroup_name		hyper-v-servers
	service_description	Service: Virtual Machine Management
	check_command		check_nt!SERVICESTATE!-d SHOWALL -l vmms
}
Notice my use of hostgroup_name so that I only have to create this service one time. If I were creating a service for a specific host, I would use host_name instead.
I encourage you to look at the documentation for services. You may want to change the frequency of when checks occur. You may also want to redefine how long a service can be in a trouble state before you are notified.
Useful Nagios Objects Documentation
I’ve spent a little bit of time going over the objects within Nagios, but there is already a wealth of documentation on them. You will, no doubt, want to configure Nagios items on your own. NSClient++ also has a great deal more capability than what I’ve shown. These links helped me more than anything else:
Dealing with Problems Reported by Nagios
The web display is nice, and everyone enjoys seeing a screen-full of happy green monitor reports, but that’s not why we set up Nagios installations. Things break, and we want to know before users start calling. With the configuration that you have, you’ll have the ability to start getting notifications as soon as you set yourself up as a contact with valid information. When a problem occurs, Nagios will mark it as being in a SOFT warning or critical state, then it will wait to see if the problem persists for a total of three check periods (configurable). One the third check, it will mark the service as being in a HARD warning or critical state and send a notification.
If you fix a problem quickly, or if it resolves on its own, you’ll get a Recovery e-mail to let you know that all is well again. If the problem persists, you’ll continue getting an e-mail every few minutes (configurable). If one host has many services in a critical state, or if many separate hosts have issues, you’re going to be looking at a lot of e-mails.
The following screenshot shows what a service looks like in a critical state. You can see it on the Services menu item, the Services submenu under the Problems menu, and on the (Unhandled) link that is next to it.

Nagios Critical Service
If you click the link for the name of the service, in this case, Service: DNS, it will take you to the following details screen:
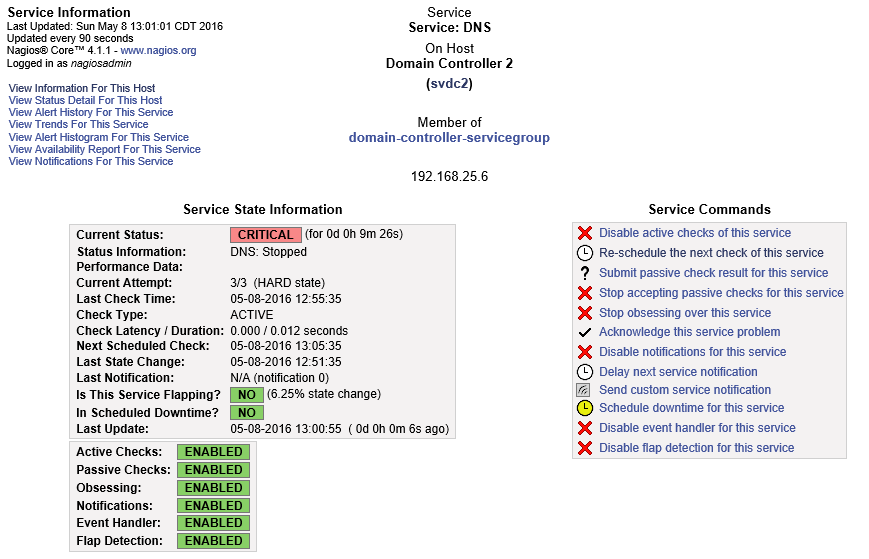
Nagios Service Detail
Take some time to familiarize yourself with this screen. I’m not going to discuss every option, but they are all useful. For now, I want you to look at Acknowledge this service problem.
Acknowledging Problems in Nagios
“Acknowledging” means that you are aware that the service is down. Once acknowledged, an acknowledgement notification will be sent out, but then no further notifications until the service is recovered. Basically, you’re telling Nagios, “Yes, yes, I know it’s down, leave me alone!” Click the Acknowledge this service problem link as shown in the previous screen shot and you’ll be taken to the following screen:
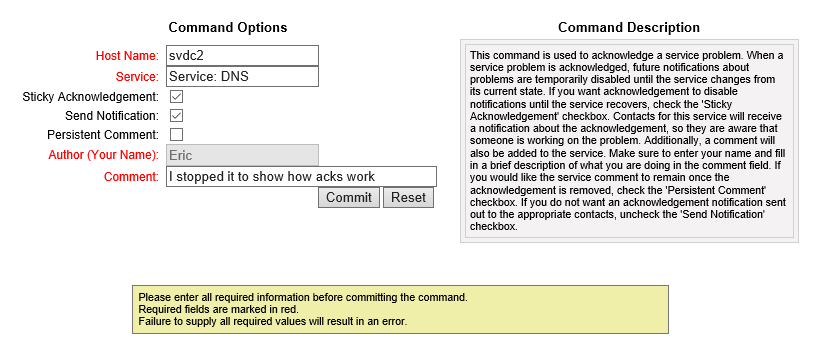
Nagios Acknowledgement
You can read the Command Description for an extended explanation of what Acknowledgement does and what your options are. I tend to fill out the comments field, but it’s up to you. Upon pressing Commit, the notification message is sent out and Nagios stops alerting until the service recovers (sometimes you get one more problem notification first).
Rescheduling a Nagios Service Check
Nagios runs checks on its own clock. You might have a service that doesn’t need frequent checks, so you might set it to only be tested every hour. During testing, you certainly won’t want to wait that long to see if your check is going to work. You might also want that Recovery message to go out right away after fixing a problem. In the service detail screen as shown a couple of screen shots up, click the Re-schedule the next check of this service link:
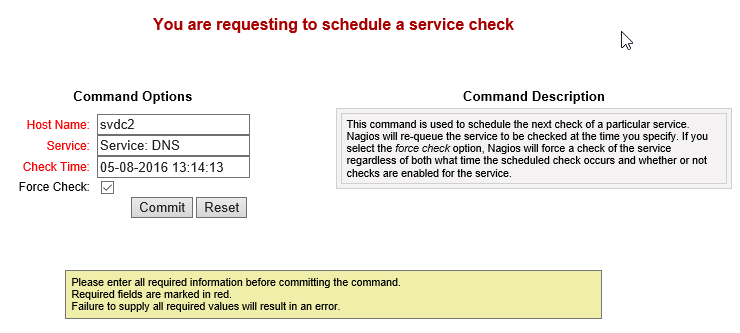
Reschedule Nagios Service Check
Of course, the time in the screen shot doesn’t mean anything to you. It’s the exact moment that I clicked the link on my system. If you then click Commit, it will immediately run the check. It might still take a few moments for the results to be returned so you won’t necessarily see any differences immediately, but the check does occur on time.
Scheduling Downtime
Smaller shops might not find it important to schedule downtime. If your Hyper-V host can reboot in less than 15 minutes, then you might not even get a downtime notification using the default settings. However, Nagios will give you the ability to start providing availability reports. Wouldn’t it be nice to show your boss and/or the company owners that your host was only ever down during scheduled maintenance windows?
From the service detail screen shot earlier, you can see the Schedule downtime for this service link. I’m assuming that you’ll be more likely to want to set downtime on a host rather than an individual service. The granularity is there for you to do either (or both) as suits your needs. A host’s detail screen (not shown) has Schedule downtime for this host and Schedule downtime for all services on this host links. You can also schedule downtime for an entire host or service group. These screens all look like this:
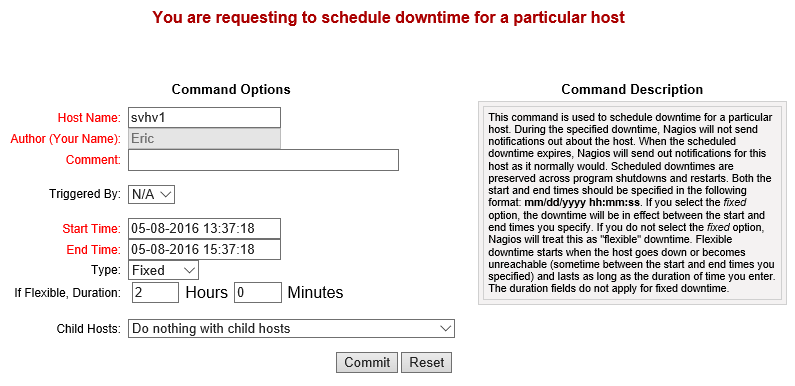
Nagios Downtime Scheduler
During scheduled downtime, notifications aren’t sent. In all reports, any outages during downtime are in the Scheduled category rather than Unscheduled.
The default Nagios Core distribution does not have a way to automatically schedule recurring downtime. There are some community-supported options.
Nagios Availability Reports
You saw a link in the service details screen shot above to View Availability Report for This Service. Hosts and services have this link. There’s also an Availability menu in the Reports section on the left that allows you to build custom reports. The following is a simple host availability report:
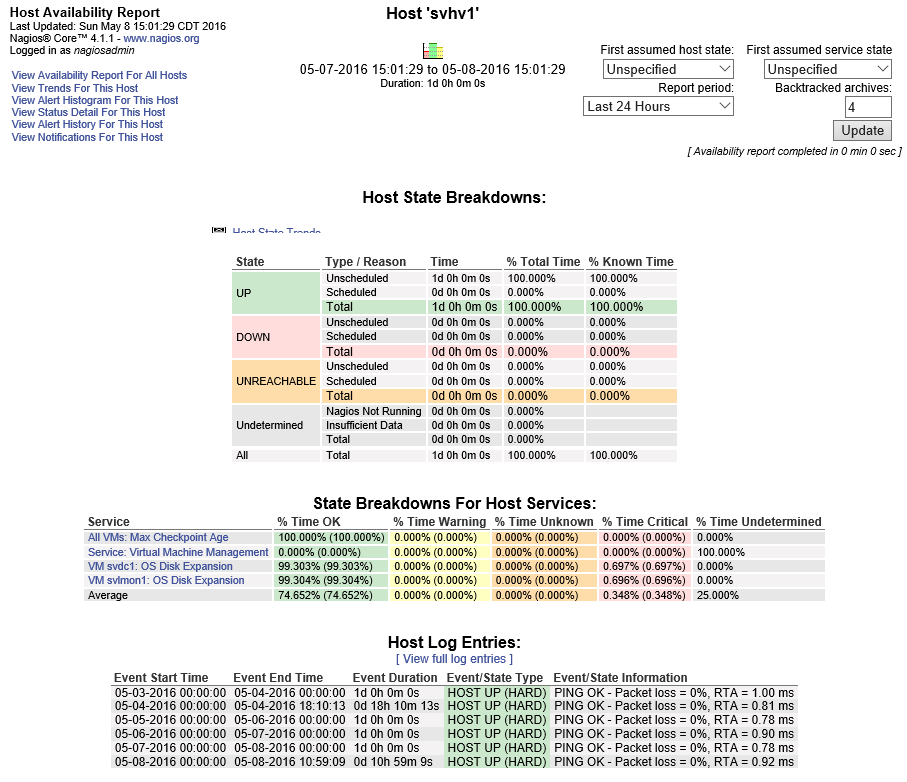
Nagios Availability
This is only for a single day. Notice the report options in the top right.
Using Nagios to Monitor Hyper-V – The real fun stuff starts here!
You now have all the tools you need to build your Hyper-V monitoring framework with Nagios. I’ve also written a few scripts and services that will get you up and running: Required Base Scripts, Monitoring the Oldest Checkpoint Age, Monitoring Dynamically Expanding VHDX Size, and more.
- www.altaro.com/hyper-v/nagios-for-hyper-v-required-base-scripts/
- www.altaro.com/hyper-v/nagios-hyper-v-monitoring-oldest-checkpoint-age/
- www.altaro.com/hyper-v/nagios-hyper-v-monitoring-dynamically-expanding-vhdx-size/


Not a DOJO Member yet?
Join thousands of other IT pros and receive a weekly roundup email with the latest content & updates!
More in this category


About the Author

Eric Siron


115 thoughts on "How to Monitor Hyper-V with Nagios"
Nice depth!
Great writeup!
Thanks for your work and above all, having taken time to explain each step, that’s very valuable.
Great article, I just spent a week figuring this all out for my self and getting nagios working- wish I’d found this first ! Definitely given me a few extras to tinker with getting the HV scripts to work 🙂
Thanks again
Great!