Save to My DOJO
Table of contents
Save for a few exceptions, all systems generate events generally written to a log file of sorts for troubleshooting and auditing purposes. These events can be triggered by the OS itself as well as by software and hardware components. Event logs are the first port of call when it comes to diagnosing problems or piecing together audit trails. These are the most common use cases that first spring to mind but I’m sure there are many more.
VMware software such as vCenter and ESXi server generate their fair share of events as do many other products and features. Regardless of whether you’re managing large environments or not, I’m pretty sure you know how daunting it can be to collect and analyse events. Imagine having to go through the events generated by a cluster of say 10 ESXi hosts, manually combing the logs on every host. If this isn’t a harrowing task, I honestly don’t know what is.
Thankfully, there are methods that can help you offload events to a central repository. How about being able to run queries against the centralized data set and being able to filter out any unwanted noise? Wouldn’t it be great to be able to receive alerts whenever important system events occur allowing you to act proactively?
Well, look no more. Today we’ll be looking at VMware vRealize Log Insight which provides a neat solution to the problem here posed.
What is vRealize Log?
In short, vRealize Log Insight allows you to visualize and analyze event information extracted from VMware setups as well as other sources. It can handle both structured and unstructured data emanating from multiple sources. Additionally, you can use Insight to perform complex analytics, searching, real-time monitoring and more. Management is carried out using a highly customizable HTML 5 interface which, in the large part, is intuitive and easy to use.
Log Insight collects data using any of two feeds, these being:
- The Syslog protocol using UDP or TCP over port 514 or TCP (SSL) over port 1514.
- The VRealize Log Insight Ingestion API using TCP over port 900 or TCP (SSL) over port 9543.
And finally, Log Insight readily integrates with vCenter Server and, optionally, with vRealize Operations Manager.
Pre-installation info
Log Insight is distributed as a virtual appliance i.e. in OVA (Open Virtual Appliance or Application) format. You’ll deploy it as you would do with any other virtual appliance via the Deploy OVF Template option from vSphere Web Console (Fig. 1).
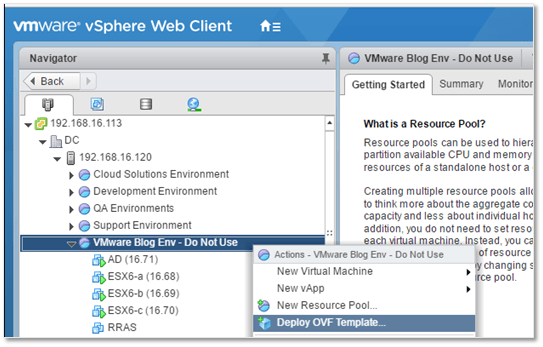
Figure 1 – Deploying vRealize Log Insight as an OVF (or OVA) template
The minimum hardware requirements for a production deployment are 8GB RAM, 4 vCPUs and 510GB of storage configured in thick provision eager zeroed mode. For Large environments, the appliance VM hardware version needs to be upgraded to version 8 to enable support for 16 vCPUS. The Sizing the vRealize Log Insight Virtual Appliance page shows you how to size your Log Insight deployment.
Note that hardware version 8 has been available since ESXi 5.0, so I’m assuming that this should not be a stumbling block for most vSphere deployments out there, if you’re going Large that is!
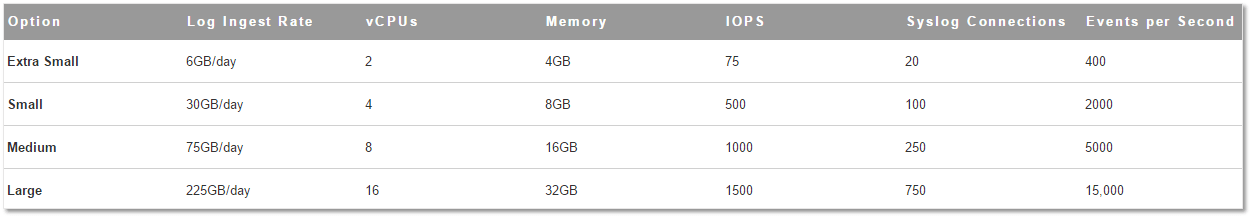
Figure 2 – Log Insight deployment types
Note: Log Insight can be deployed as a standalone instance or as an addition to an existing cluster for improved performance and HA capabilities (depends on license). For this series, I’ll be using a standalone instance of Log Insight version 4.0.0 (4624504).
Licensing Facts
You can use any valid vCenter Server product key (Standard, Enterprise or Enterprise Plus) to license Log Insight. This allows you to monitor a single vCenter Server instance plus 24 other VMware resources such as ESXi hosts, VMs, etc. This is referred to as the 25 OSI (Operating System Image) pack which unlocks all the features applicable to vRealize Log Insight for vCenter Server Standard.
A full license unlocks all the available features, including clustering and HA, applicable to Full vRealize Log Insight while a third flavour, vRealize Log Insight for NSX, is freely available if you’ve purchased NSX 6.2.4 or better.
If you just want to test the product out, you’d be happy to know that you can use Log Insight freely and with no restrictions for up to 60 days, which is what I’m doing at the moment!
The Log Insight pricing model is based on Operating System Image (OSI) or single CPU usage. The full licensing details and more are available here.
Deploying the vRealize Log Insight appliance
Before proceeding with the installation, go ahead and download a trial evaluation of Log Insight from my.vmware.com. The 60-day license key should be available on the same download page. You also need sufficient permissions to deploy an OVF template to vCenter Server.
That out of the way, I can now go through the deployment steps.
Step 1 – Using the vSphere Web Client, log in the vCenter Server on which you’d like Log Insight installed. Right click on a VM folder or a Resource Pool and select Deploy OVF Template from the context menu.
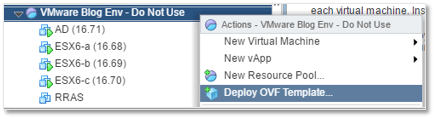
Figure A1 – Deploying an OVF template to vCenter Server
Step 2 – Select Local File, click on Browse and locate the folder containing the downloaded OVA file. Select the OVA file and click Next.
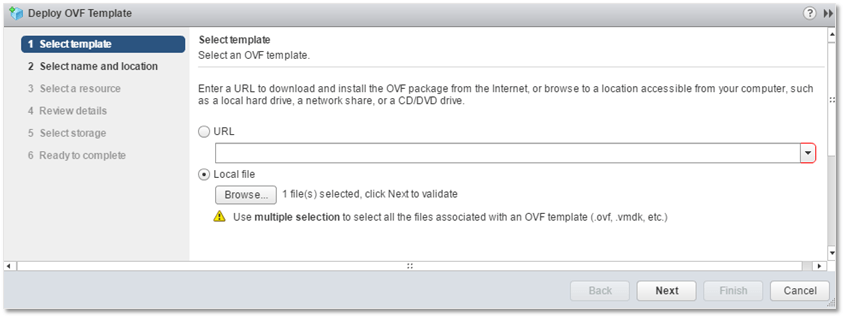
Figure A2 – Specify the local folder under which the Log Insight OVF file is stored
Step 3 – Select the VM folder under which you want Log Insight deployed and click Next.
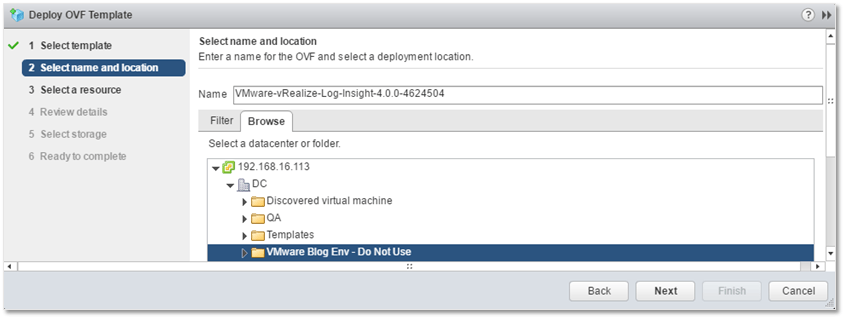
Figure A3 – Selecting the VM folder for Log Insight
Step 4 – If applicable, select the Resource Pool under which you want Log Insight deployed and click Next.
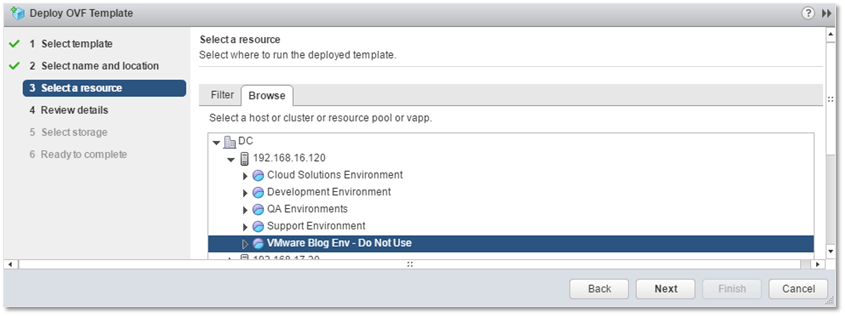
Figure A4 – Selecting a resource pool for Log Insight
Step 5 – This screen is just a summary of sorts. Clicking on Next takes you the License Agreements screen (not included here). Just click on the Accept and Next buttons to continue.
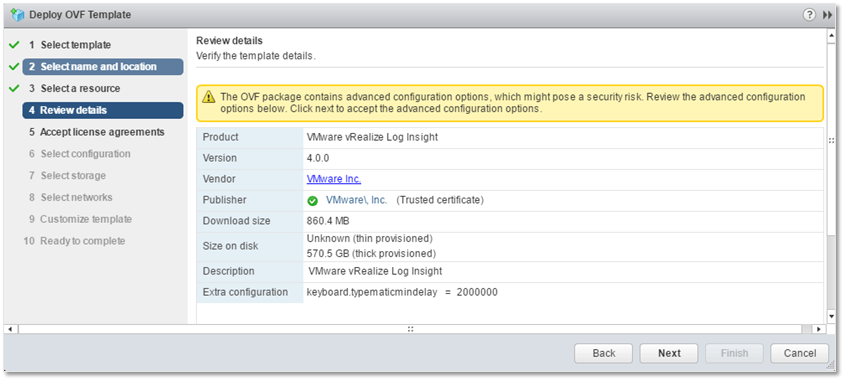
Figure A5 – OVF details summary
Step 6 – On this next screen you will specify the deployment size. In my case, I’ve selected the Extra Small configuration to minimize resource utilization since this is just for demo purposes, which is precisely why the Extra Small option is included.
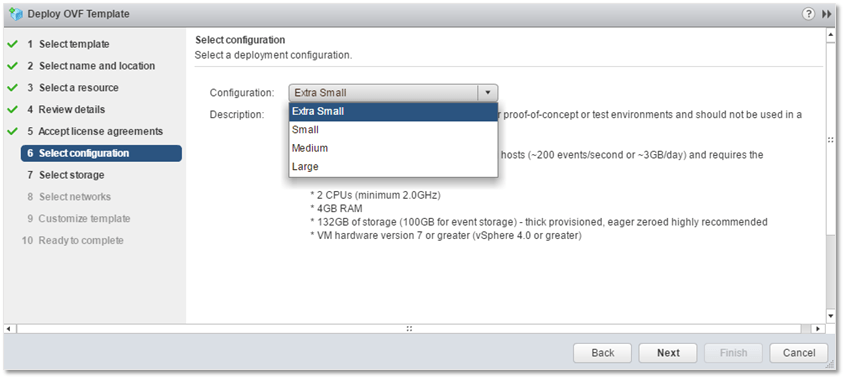
Figure A6 – Sizing a Log Insight deployment
Step 7 – Select the datastore where the appliance will be created and select the disk provisioning type.
Note: In a live setting, stick to using Thick provision eager zeroed configuration. I’ve selected thin provisioning to cut down on resource utilization moreso this being a temporary installation. Keep in mind that while thin provisioning can still be used, you’ll incur a performance penalty and risk competing with other VMs for disk space should you oversubscribe storage. Datastore Clusters are also supported. Press Next to continue.
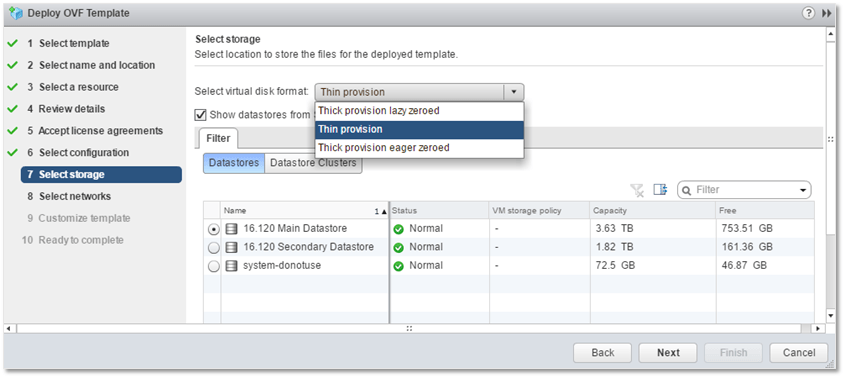
Figure A7 – Selecting a datastore for Log Insight
Step 8 – Select the portgroup to which the Log Insight appliance connects and press Next.
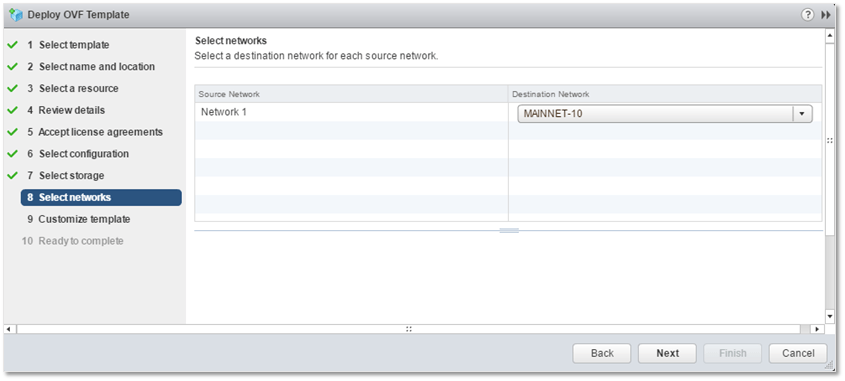
Figure A8 – Selecting a network (portgroup)
Step 9 – On the Customization screen, specify the appliance’s DNS name, the network configuration and the root password. As custom, I created any required DNS records well in advance of the installation. You can optionally include an SSH Public Key which is appended to existing ones. Press Next to continue.
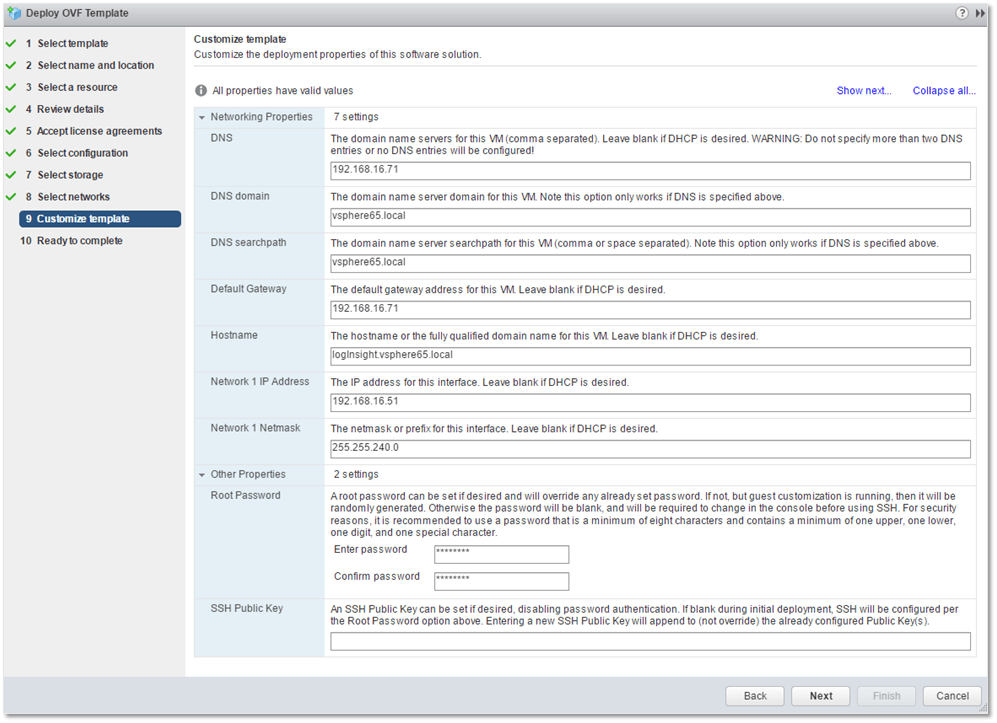
Figure A9 – Customizing Log Insight
Step 10 – Press Finish to finally deploy the appliance.
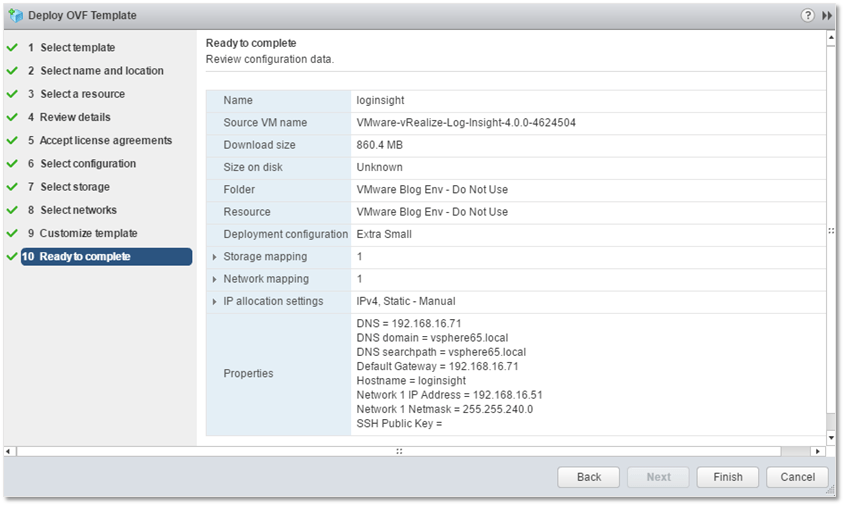
Figure A10 – Ready to deploy Log Insight
Step 11 – Once the OVF deployment completes, go ahead and power it on. The appliance may reboot after an initialization process that may take a few minutes to complete. When done, check that the appliance is running with the correct IP address and DNS name.
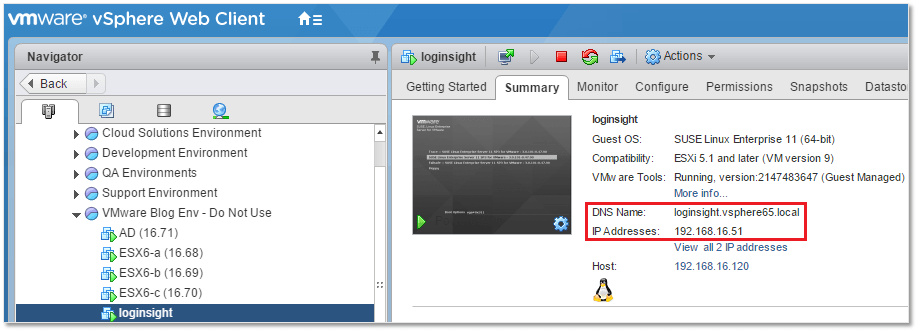
Figure A11 – Verifying the appliance’s IP and hostname
Configuring a new Log Insight deployment
Once the Log Insight appliance has been deployed, the next obvious step is to configure it.
Step 1 – Point your browser to https://<Log Insight IP address or FQDN> and click on the Next button to kick off the configuration process.
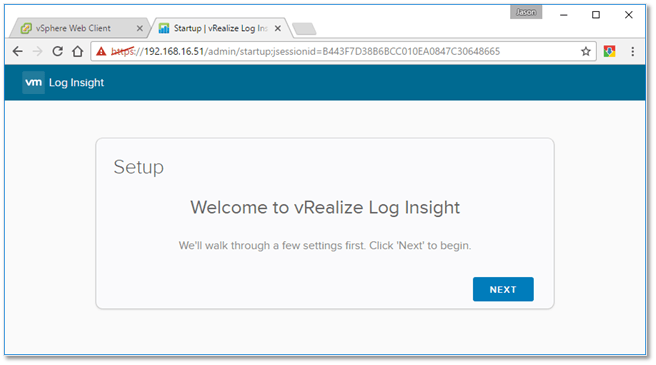
Figure B1 – Log Insight setup landing page
Step 2 – On this next screen, you have the option to either join the appliance to an existing Log Insight cluster or set up a new one. I’ve chosen Start New Deployment since I do not have any cluster to add this Log Insight instance to.
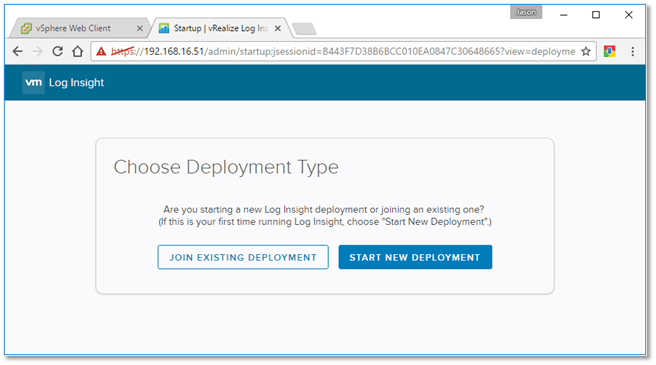
Figure B2 – Configuring a new Log Insight deployment
Step 3 – Type in the admin password. Optionally, you can also supply an email address for the admin user.
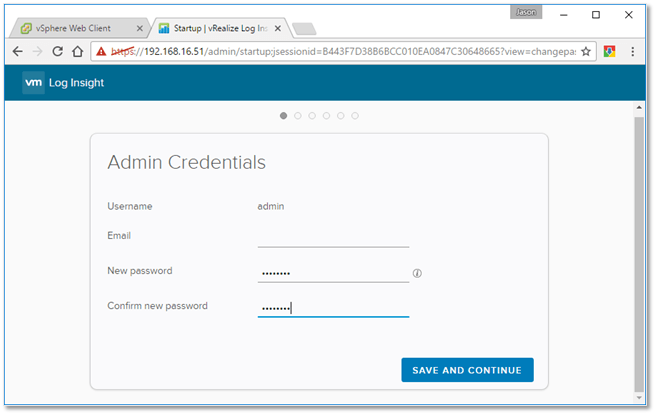
Figure B3 – Specifying the Admin credentials
Step 4 – A license key should be added next. Just type in the trial key or otherwise and click on Save and Continue. Without a valid license key, you will only be able to manage a single host.
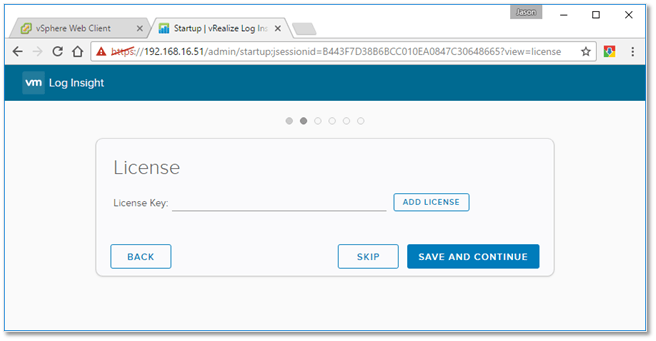
Figure B4 – Assigning a licence key
Step 5 – On the General Configuration screen, supply an email address where you can receive system notifications. Optionally, you can specify what are referred to as webhooks used by Log Insight to connect and forward notifications to vRealize Operations and similar apps. Press Save and Continue.
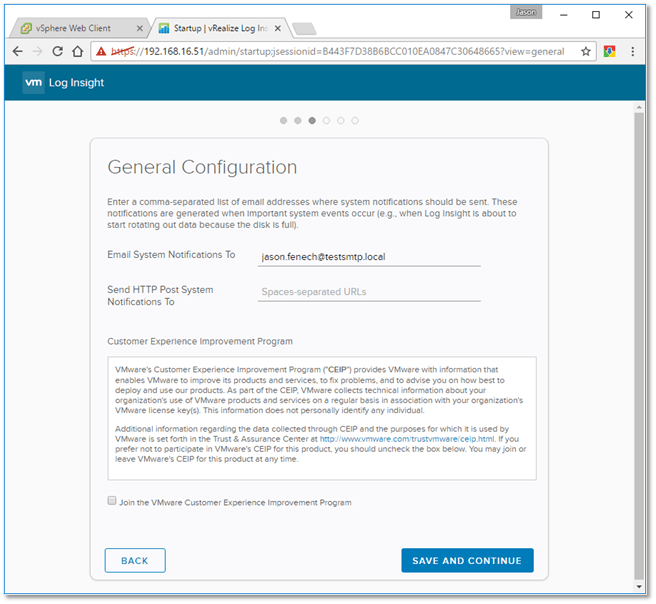
Figure B5 – System notifications and Webhooks configuration
Step 6 – Set the appliance to sync time with an internal or external NTP source. If access to NTP services is restricted, set the appliance to time sync with the ESXi server hosting it. Press Save and Continue.
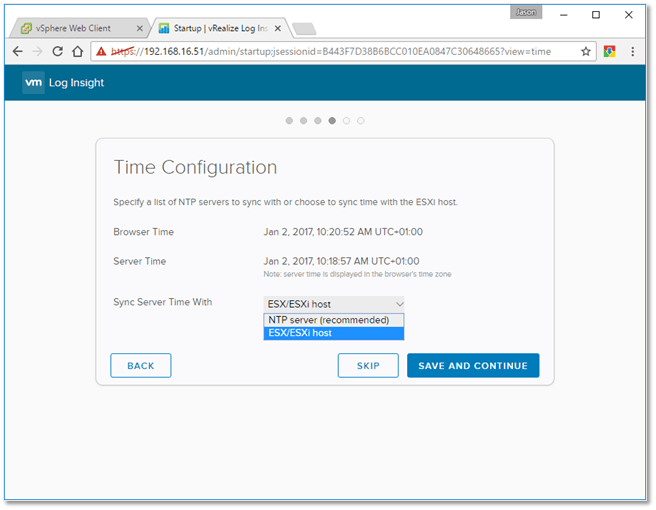
Figure B6 – Configuring a time source
Step 7 – On the SMTP Configuration screen, type in the relevant SMTP settings to enable the successful delivery of notification and alerts. Some settings, like credentials, are optional. Their inclusion depends mostly on your email server’s configuration. Click on Save and Continue.
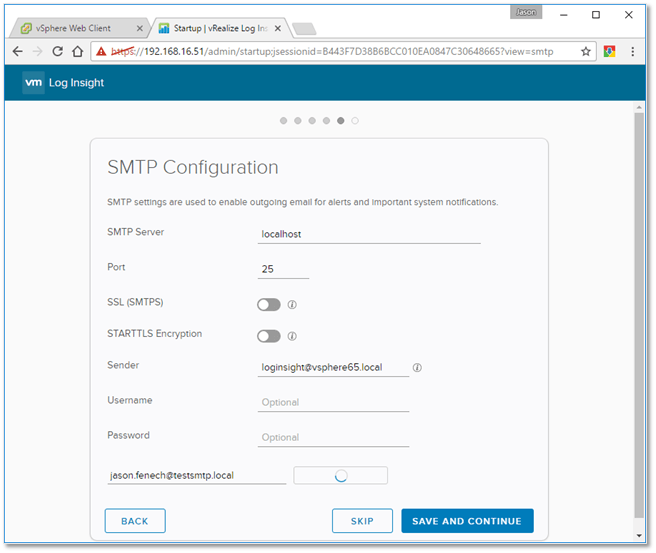
Figure B7 – Configuring SMTP settings for alerts and system notifications forwarding
Step 8 – Press Finish to complete the basic configuration process.
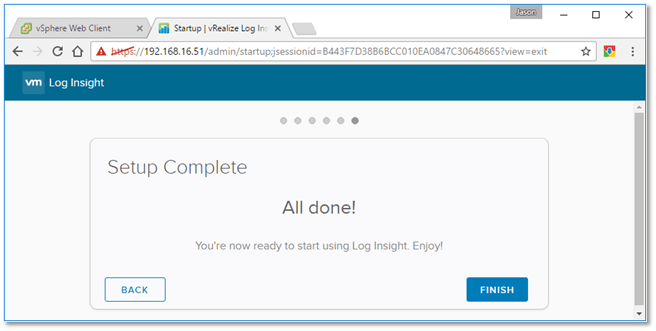
Figure B8 – Configuration successfully completed
vSphere Integration
At this point Log Insight is ready to start receiving or, as the jargon goes, ingesting data. However, we first have to configure a data source from where events are forwarded to the Log Insight server. The logical thing to do is to have vCenter Server and ESXi designated as such.
This is exactly what the Configure vSphere Integration option is there for. This configuration task can be run from the Home screen as shown in Figure C1 or from the Administration menu as shown in Figure C2.
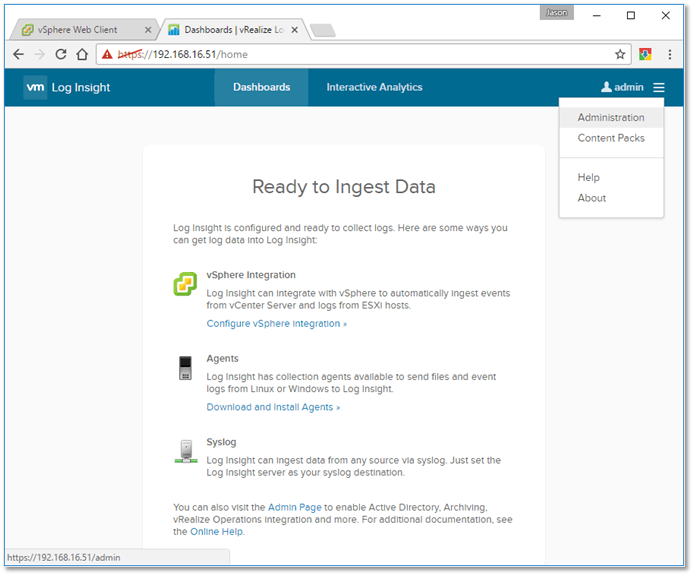
Figure C1 – Setting up Log Insight for vSphere Integration
To set up vSphere Integration, carry out the following (see Fig. C2).
1] Type in the FQDN of the vCenter Server together with a set of valid credentials. Click on the Test Connection button to verify that vCenter Server can indeed be reached.
2] Enable the Configure ESXi hosts … option and click on Advanced Options. A list of all the managed ESXi hosts is displayed along with a number of other options. You can select which ESXi hosts you want configured for syslog (event forwarding) by ticking the appropriate boxes and clicking on Configure. Additionally, when enabling the Automatically configure all ESXi hosts option, Log Insight will periodically scour for unconfigured ESXi hosts and configure them automatically. Finally, specify whether the syslog protocol will be using UDP, TCP or SSL. The default is UDP over port 514.
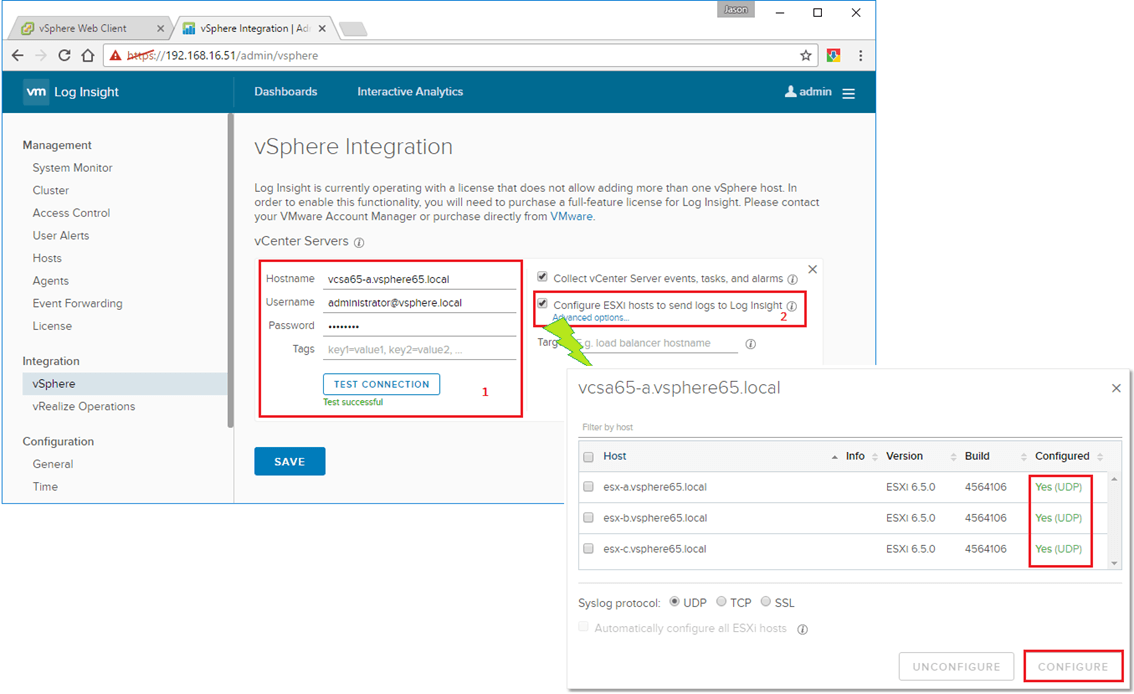
Figure C2 – Configuring vSphere Integration for vCenter Server and managed ESXi hosts
To monitor additional vCenter Server instances, click on the Add vCenter Server option (Fig. C3) and repeat the vSphere Integration procedure.
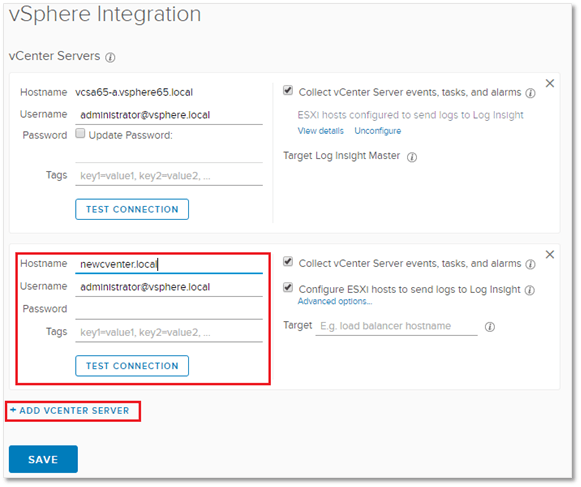
Figure C3 – Integration additional vCenter Servers
After completing the vCenter Integration process, you should start seeing the data flowing in after a few minutes. Assuming you’re still logged in, click on Dashboards (Fig. C4 – 1). From the Dashboards drop down menu (Fig. C4 – 2), select VMware – vSphere (Fig. C4 – 3). This view exposes a plethora of information about your vSphere environments. Data is grouped under a number of categories accessible from a list in the left-hand pane as per Fig. C4.
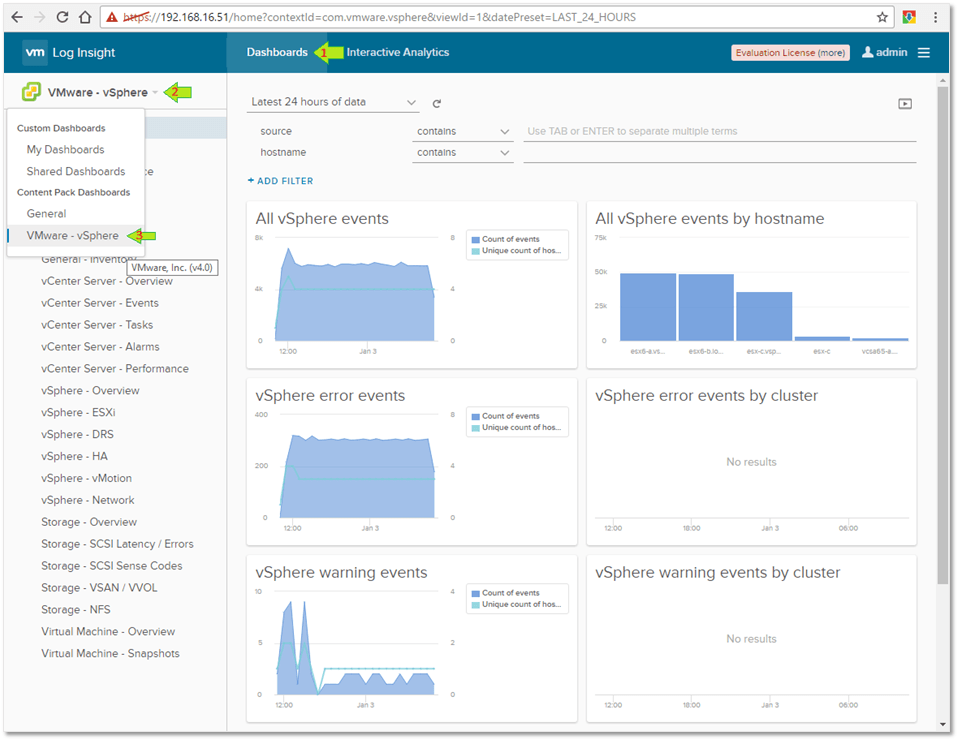
Figure C4 – The vSphere – VMware dashboard, provides a wealth of information on your vSphere deployment
If a session expires or you simply come back to using the Log Insight interface, all you need to do is point a browser to https:\\<Log Insight IP address or FQDN>. Use admin and its associated password to log in, though I highly recommend dedicated user accounts set up according to their intended use.
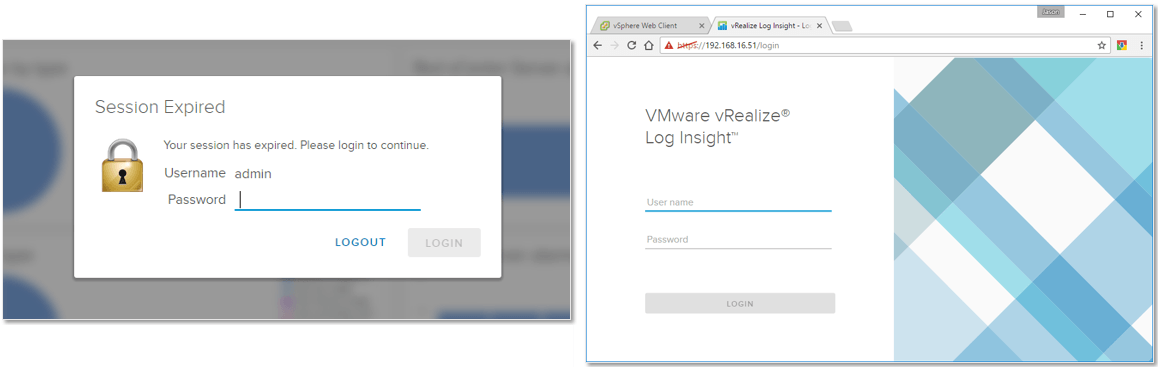
Figure C5 – Logging in after a session timeout or afresh
Conclusion
This concludes a rather lengthy post. Hopefully, after reading this post you should be armed with sufficient knowledge to enable you to deploy vRealize Log Insight to your environments. In one or more future posts, I will try and tackle some Log Insight fundamentals such as installing Log Insight agents on Windows and Linux, how to customize dashboards, set up queries and more.
With that in mind, make sure to visit this space regularly for more posts on all things VMware.
PS: The post on the Log Insight agents was published in advance of this post. If you’d like to read more, have a look at How to set up vRealize Log Insight agents on Windows and Linux.
[the_ad id=”4738″][the_ad id=”4796″]


Not a DOJO Member yet?
Join thousands of other IT pros and receive a weekly roundup email with the latest content & updates!
More in this category


About the Author
Jason Fenech


48 thoughts on "vRealize Log Insight: A first look and how to deploy it"
Good Job
Thanks. Appreciated!
Hi thanks for your time in posting.
I find Vmware Hub from Altaro are very valuable one stop shop for information on anything Vmware related. I have vRealize Log insight installed at my work and was wondering if you would be able to send me any good links to show how to best navigate and use this tool to proactively pickup issues in our invironment.
Thanks again
Tony
Hi Tony, you might try the resources page here: https://www.vmware.com/products/vrealize-log-insight.html The forums over on the VMware communities page is growing as well.
Great job! can you please help to find a script to auto install vRealize Log Insight?