Save to My DOJO
Windows 8 and Server 2012 introduced a nifty little cmdlet called Measure-VM. This PowerShell cmdlet gives us the ability to quickly gather resource information on VMs which can be pretty beneficial in certain situations. However, it does require a few prerequisites in order to use the command.
Prerequisites for Running Measure-VM
There are 3 prerequisites for being able to use the Measure-VM cmdlet:
- At least Windows 8/Server 2012 or higher needs to be installed in order to obtain the Hyper-V module that contains the Measure-VM cmdlet.
- If running the cmdlet from a Windows 8 machine, Hyper-V PowerShell modules will need to be installed, this can be easily done through the “turn Windows features on or off screen in control panel”.
- Resource Metering will need to be enabled on the VM that the Measure-VM cmdlet is being ran against.
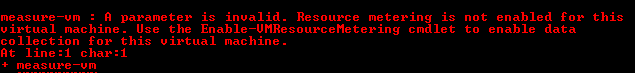
If resource metering is not enabled on the VM you will get the error message below:
Also, note that you might want to run the Update-Help cmdlet to get the most recent help files for the cmdlet. To do this, type the following command:
Update-help
Powershell will then download the latest help files from the internet.
Getting Started with Measure-VM
Resource metering is a new feature in Windows Server 2012. The main function of this feature is to give administrators an easy way for tracking the resource usage of each VM. This allows cloud providers to bill clients for actual resources consumed instead of using a flat cost model. It also allows IT departments running private clouds to accurately compute chargebacks for the other departments. The Measure-VM cmdlet piggy-backs off the information gathered from resource metering to generate a table with the gathered data. There’s a good overview on Microsoft’s TechNet on resource metering for Hyper-V for more information on that topic.
How to Use the Measure-VM Cmdlet
Now that we have all the prerequisites in order, we can now benefit from using the Measure-VM cmdlet.
Enabling Resource Metering and Resetting Counters
Metering is disabled by default when VMs are created, however enabling it will not create any noticeable impact on performance. A simple way of enabling resource metering on all VMs is by running the following syntax:
Get-VM –Name * -Computername Hypervhost1,hypervhost2,hypervhost3 | enable-vmresourcemetering
If you would like to enable it only on specific VMs, then use the same syntax as above but, instead of using an asterisk (*) for specifying all VMs, use the specific name of the VMs you’d like resource metering enabled on.
You can also reset the counters for all virtual machines on the host, which will allow you to gather fresh data:
Get-VM –VMName * -ComputerName Hypervhost1,Hypervhost2 | Reset-VMResourceMetering
The syntax for the Measure-VM cmdlet is simple:
Measure-VM –Name VMname –Computername nameofHyperVhosts
In this example we have a Hyper-V cluster set up with 2 hosts: TGLAB-HV01 and TGLAB-HV02. It is running a VM named TGLAB-DC01 and we’d like to get resource information about it. To do so, type the following command:
Measure-VM –name TGLAB-DC01 –Computername TGLAB-HV01
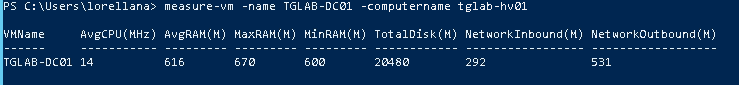
Powershell communicates with the Hyper-V host and grabs the information obtained from the resource metering feature then reports back to the shell interface with the information that’s been retrieved.
Viewing Resource Metering Across Multiple Hosts
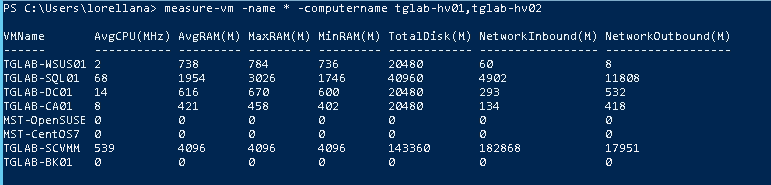
You can also view all the VMs on multiple hosts by using the asterisk (*) symbol in place of the VM name. In the example below, we grab information for all VMs on both hosts in the cluster:
Measure-VM –Name * -Computername TGLAB-HV01,TGLAB-HV02
Now a table is created with VM information from both hosts.
Reading the Information from Measure-VM
You’ve installed the prerequisites, ran the cmdlet, and gathered information on all the hosts in your cluster. Now, how do you read the table to get the information you’re looking for? You can either go to the Microsoft TechNet article that explains the different fields in the Measure-VM cmdlet, or you can be more efficient and use the Get-Help cmdlet to look up the description of all the fields right within the PowerShell console itself.
Type in the Get-Help command to read the help file:
Get-Help –name Measure-VM
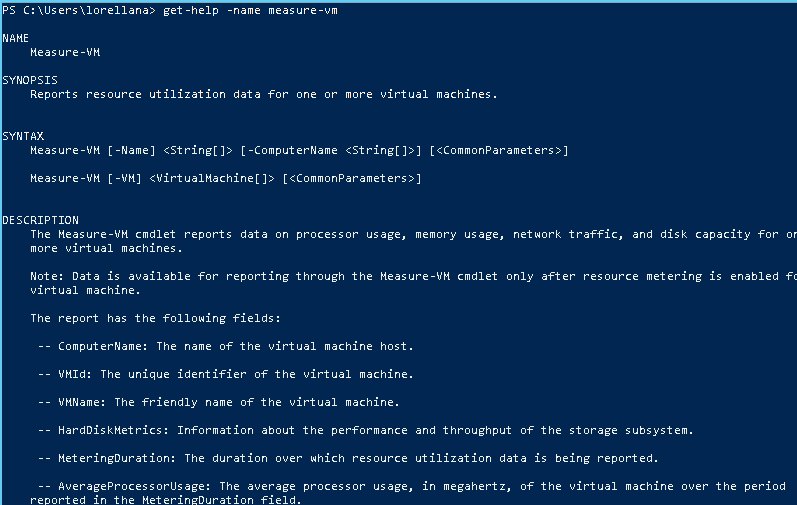
This will tell PowerShell to find the help file associated with the Measure-VM cmdlet and to output the information to the shell interface. The help file for the Measure-VM cmdlet will actually list each field that is available to view data from and also provides a description. For example, we know that the Total Disk(M) field is the average disk usage in MB of the VM by reading its description in the help file.
![]()
There is also more information that can be viewed when running Measure-VM other than the default fields shown in the example above. The fields available to view are listed in the help file. For example if you just wanted to see each VM, the total disk space allocated to each VM, and the host that they reside on, you’d use the following syntax:
Measure-VM –Name * -Computername TGLAB-HV01,TGLAB-HV02 | select-object –property vmname,computername,totaldisk
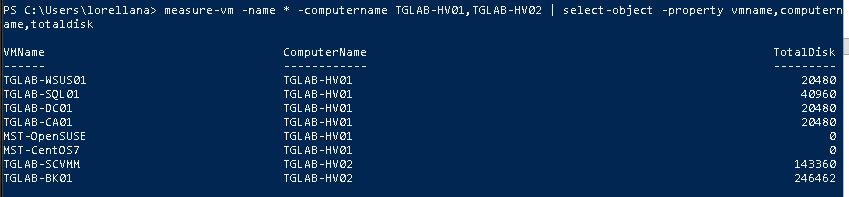
You would pipe the information to the Select-Object cmdlet and then list the properties you would like to view using the –property parameter.
Practical Use
In addition to chargeback, the Measure-VM cmdlet provides IT pros the ability to quickly find resource information on hosted VMs. This can be beneficial in many ways. For example, imagine we have a two host cluster with a SAN. Users call in complaining of slowness and when checking the SAN you determine that it is being taxed with more IOPS than it can handle. Now it’s time to figure out which VM or VMs are causing the IOPS spike. Thanks to PowerShell we can locate this information in a matter of seconds by running the following commands:
First we reset the counters to get fresh statistics on our VMs. We do not have to wait for this to start collecting data because if there is indeed an issue with IOPS on a VM, it will already start to show in the readings.
get-vm -vmname * -computername TGLAB-HV01,TGLAB-HV02 | reset-vmresourcemetering
Next we run the following commands to gather the VMname and hard disk metrics of each VM:
Measure-VM –Name * -Computername TGLAB-HV01,TGLAB-HV02 | Select-Object vmname –expandproperty harddiskmetrics
![]()
In this example, we used the Asterisk (*) to tell PowerShell to grab information from all VMs. Then we specified the two Hyper-V hosts we’d like to retrieve information from using the -ComputerName parameter. Next, we pipe all the information to the Select-Object cmdlet which allows us to only view the properties that we are interested in. In this example, we specify the property VMNAME so we can see the name of the VM that we are looking at, as well as the property HARDDISKMETRICS so we can see the performance and throughput of the VM. Usually, you would just list all of the desired properties you want to view after the property parameter (for example: -property VMNAME, AVERAGEMEMORYUSAGE,AVERAGEPROCESSORUSAGE). However, a few of the properties (like HARDDISKMETRICS and NETWORKMETEREDTRAFFICREPORT) are actually arrays that contain more properties. Because of this, you have to specify the –expandproperty parameter to expand all the information in that array. The output of the command looks like this:
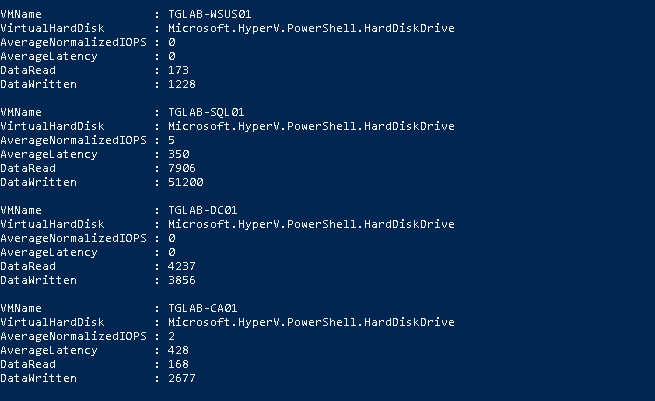
We can now view the throughput of each VM and begin to narrow down the cause of the spike in IOPS.
Also note that metering does not replace performance monitoring as it only gathers performance snapshots. In this scenario, Measure-VM is just used as a tool to quickly isolate an issue. We would want to use another tool to do a more in-depth diagnosis to see why the IOPS are spiking on that VM.
Not only could you use Measure-VM for quickly gathering resource information to troubleshoot an issue, but also in creating scripts that generate HTML reports containing resource information for each VM. Generating a reoccurring HTML report can be useful in establishing chargeback for departments. For example, if the HR department uses an SQL server to host the database for their HR software, we can now measure the resources used each month by that VM and essentially “bill back” to that department.


Not a DOJO Member yet?
Join thousands of other IT pros and receive a weekly roundup email with the latest content & updates!
More in this category


About the Author

Luke Orellana


2 thoughts on "How to Use the Measure-VM Cmdlet"
Hi, this was a very helpful guide. I have a question though. When I ran the command below, the result showed as a set of rows instead of as columns.
Measure-VM -Name * | select-object -property VMName, MeteringDuration, AverageProcessorUsage, AverageMemoryUsage, TotalDiskAllocation
RESULT
VMName:
MeteringDuration:
…
EXPECTATION
VMName MeteringDuration …
Is there any way to solve this? Thanks in advance!
Hi Josh,
Swap out “select-object” with “Format-Table”. This will modify the output to a table:
Measure-VM -Name * | Format-Table -property VMName, MeteringDuration, AverageProcessorUsage, AverageMemoryUsage, TotalDiskAllocation
This should give you the format your looking for with the columns.
-Thanks!